Leavenworth, KS
Demographics And Statistics
Living In Leavenworth, Kansas Summary
Life in Leavenworth research summary. HomeSnacks has been using Saturday Night Science to research the quality of life in Leavenworth over the past nine years using Census, FBI, Zillow, and other primary data sources. Based on the most recently available data, we found the following about life in Leavenworth:
The population in Leavenworth is 37,176.
The median home value in Leavenworth is $253,286.
The median income in Leavenworth is $71,239.
The cost of living in Leavenworth is 89 which is 0.9x lower than the national average.
The median rent in Leavenworth is $1,135.
The unemployment rate in Leavenworth is 4.2%.
The poverty rate in Leavenworth is 12.3%.
The average high in Leavenworth is 64.9° and the average low is 44.2°.
Leavenworth SnackAbility
Overall SnackAbility
Leavenworth, KS Crime Report
Crime in Leavenworth summary. We use data from the FBI to determine the crime rates in Leavenworth. Key points include:
There were 1,139 total crimes in Leavenworth in the last reporting year.
The overall crime rate per 100,000 people in Leavenworth is 3,083.5 / 100k people.
The violent crime rate per 100,000 people in Leavenworth is 495.4 / 100k people.
The property crime rate per 100,000 people in Leavenworth is 2,588.1 / 100k people.
Overall, crime in Leavenworth is 45.50% above the national average.
Total Crimes
Above National Average
Crime In Leavenworth Comparison Table
| Statistic | Count Raw |
Leavenworth / 100k People |
Kansas / 100k People |
National / 100k People |
|---|---|---|---|---|
| Total Crimes Per 100K | 1,139 | 3,083.5 | 2,395.1 | 2,119.2 |
| Violent Crime | 183 | 495.4 | 438.7 | 359.0 |
| Murder | 0 | 0.0 | 3.8 | 5.0 |
| Robbery | 19 | 51.4 | 30.9 | 61.0 |
| Aggravated Assault | 147 | 398.0 | 359.9 | 256.0 |
| Property Crime | 956 | 2,588.1 | 1,956.4 | 1,760.0 |
| Burglary | 165 | 446.7 | 261.6 | 229.0 |
| Larceny | 728 | 1,970.8 | 1,458.5 | 1,272.0 |
| Car Theft | 63 | 170.6 | 236.3 | 259.0 |
Leavenworth, KS Cost Of Living
Cost of living in Leavenworth summary. We use data on the cost of living to determine how expensive it is to live in Leavenworth. Real estate prices drive most of the variance in cost of living around Kansas. Key points include:
The cost of living in Leavenworth is 89 with 100 being average.
The cost of living in Leavenworth is 0.9x lower than the national average.
The median home value in Leavenworth is $253,286.
The median income in Leavenworth is $71,239.
Leavenworth's Overall Cost Of Living
Lower Than The National Average
Cost Of Living In Leavenworth Comparison Table
| Living Expense | Leavenworth | Kansas | National Average | |
|---|---|---|---|---|
| Overall | 89 | 87 | 100 | |
| Services | 94 | 93 | 100 | |
| Groceries | 95 | 98 | 100 | |
| Health | 84 | 98 | 100 | |
| Housing | 83 | 78 | 100 | |
| Transportation | 87 | 88 | 100 | |
| Utilities | 109 | 109 | 100 | |
Leavenworth, KS Weather
The average high in Leavenworth is 64.9° and the average low is 44.2°.
There are 63.7 days of precipitation each year.
Expect an average of 39.4 inches of precipitation each year with 16.9 inches of snow.
| Stat | Leavenworth |
|---|---|
| Average Annual High | 64.9 |
| Average Annual Low | 44.2 |
| Annual Precipitation Days | 63.7 |
| Average Annual Precipitation | 39.4 |
| Average Annual Snowfall | 16.9 |
Average High
Days of Rain
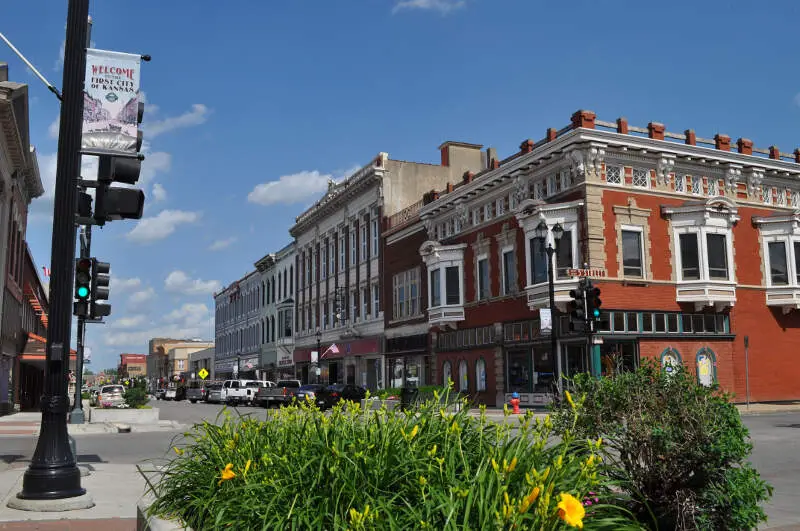
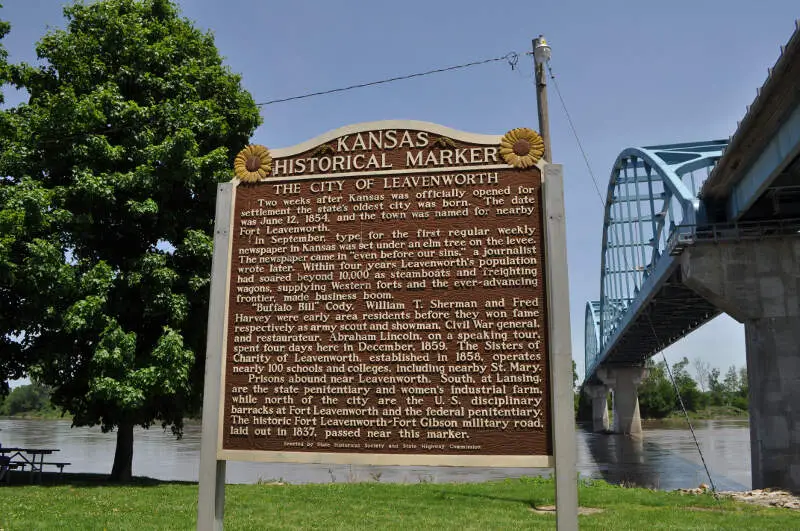
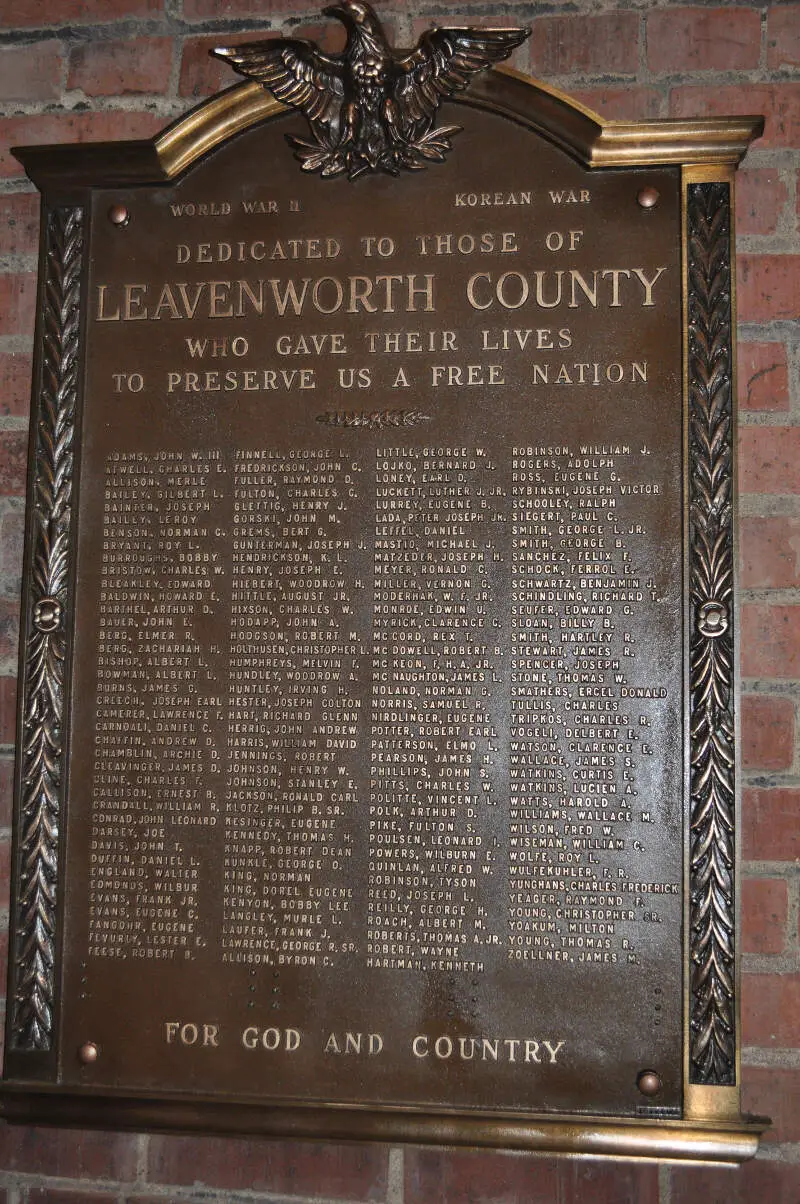
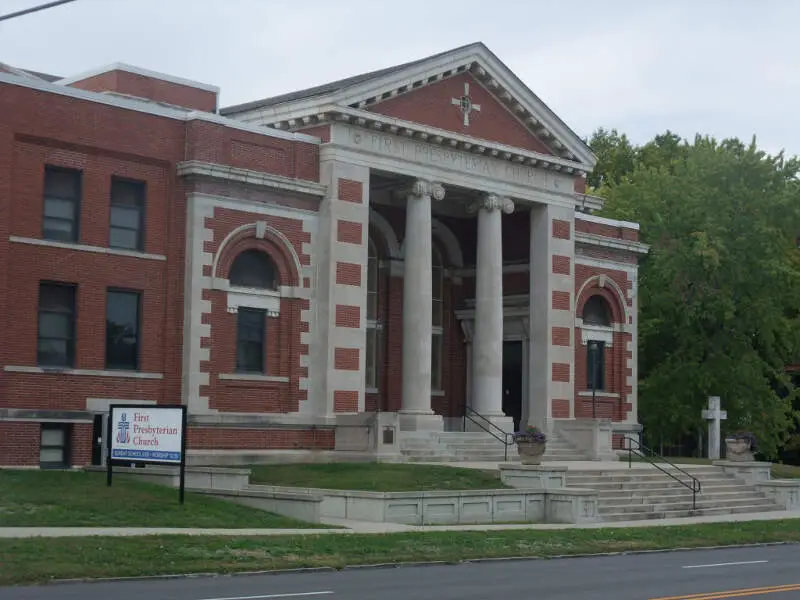
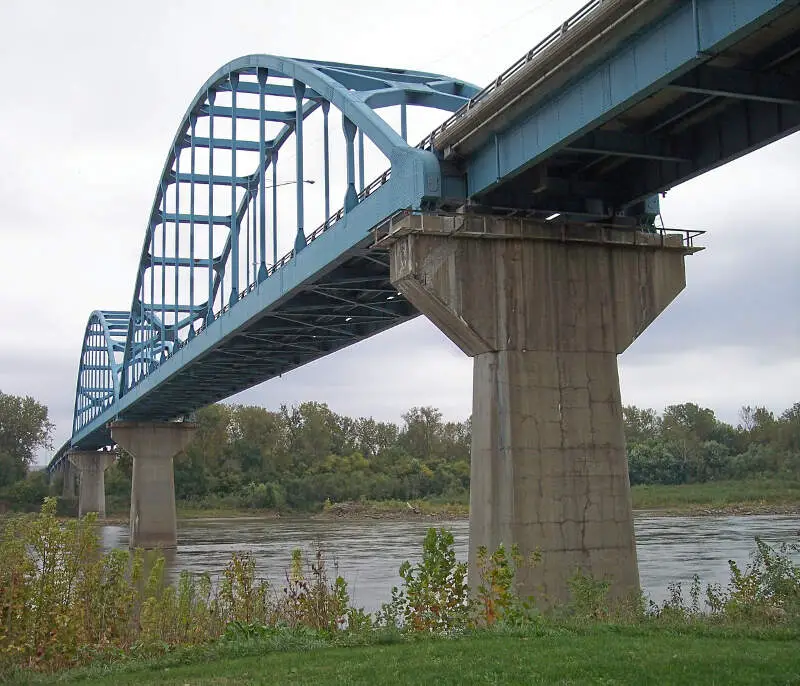
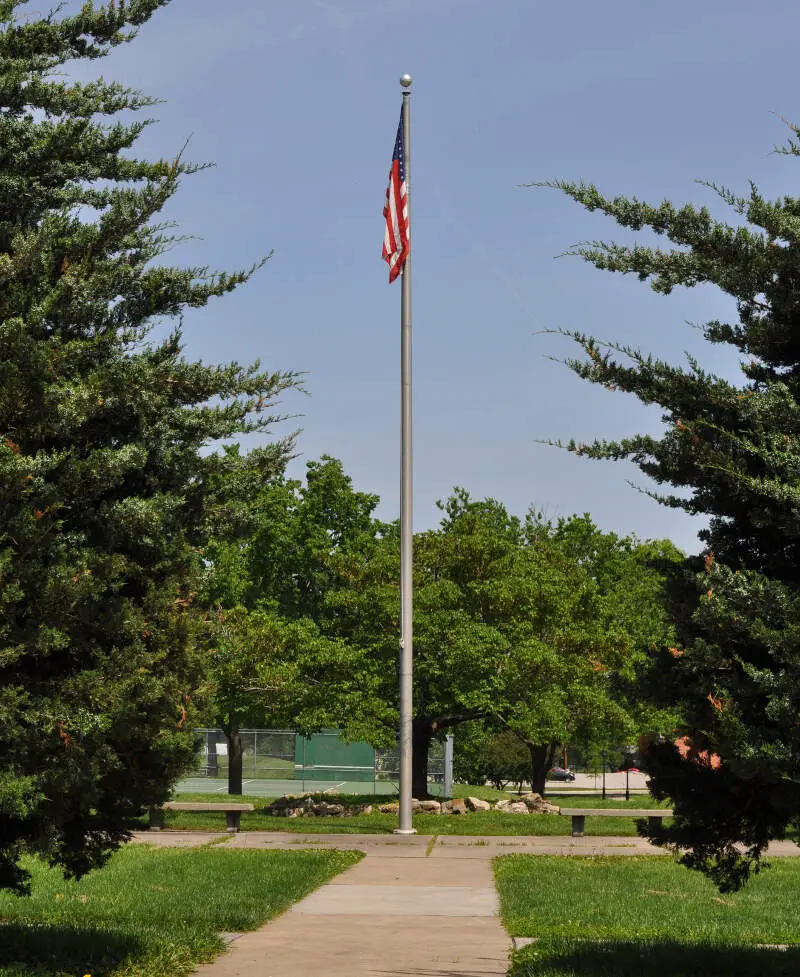
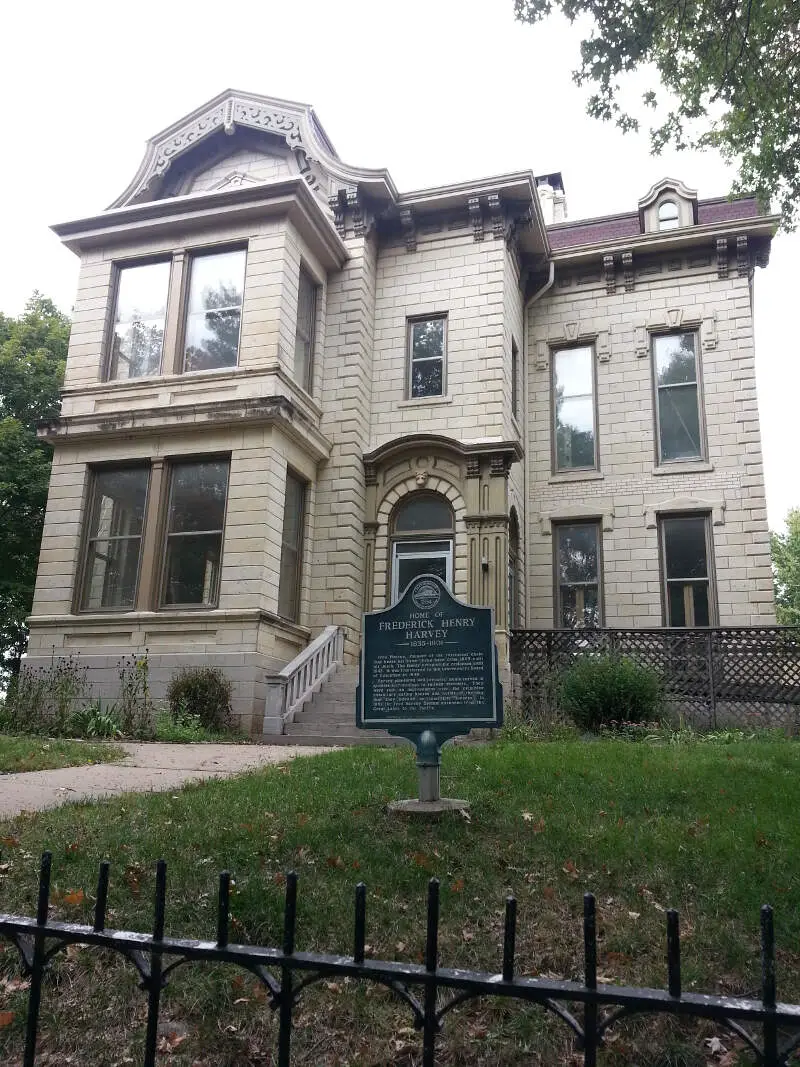
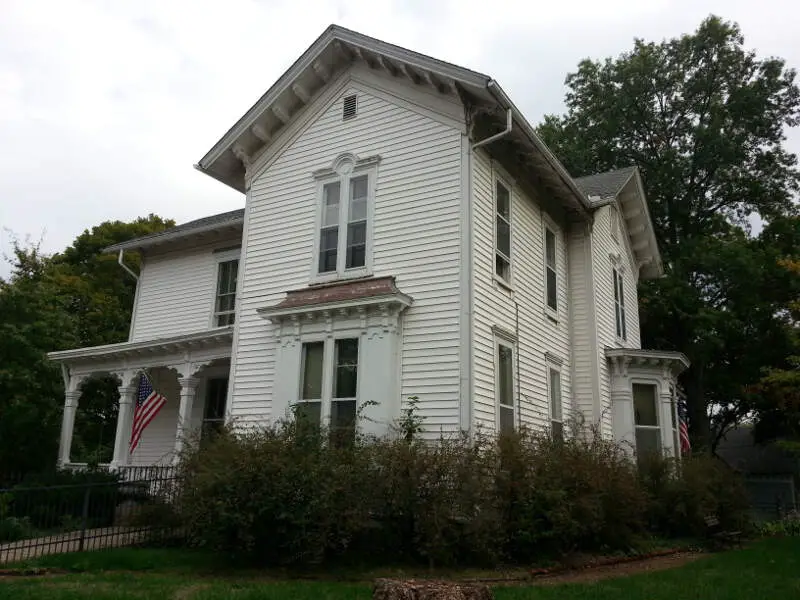
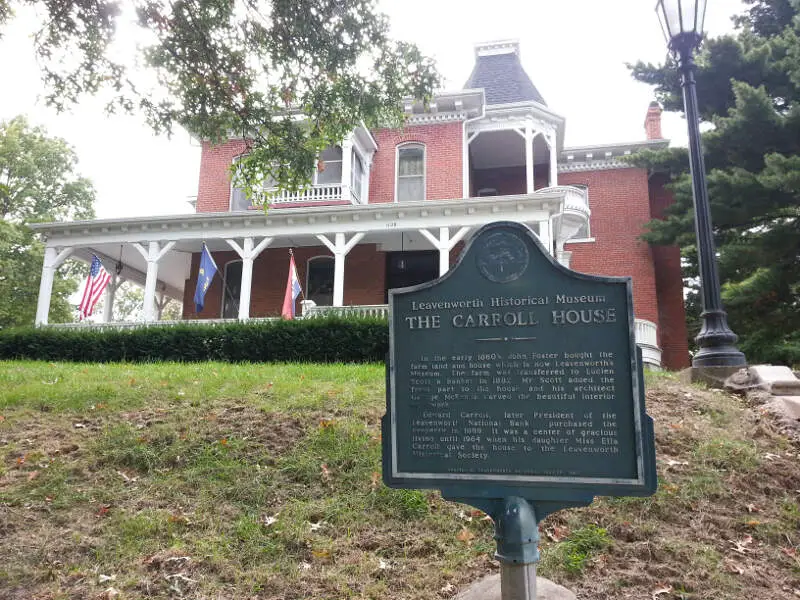
Leavenworth, KS Photos
Rankings for Leavenworth in Kansas


Locations Around Leavenworth
Map Of Leavenworth, KS
Best Places Around Leavenworth
Parkville, MO
Population 8,022
Smithville, MO
Population 10,552
Basehor, KS
Population 7,229
Lansing, KS
Population 11,229
Edwardsville, KS
Population 4,721
Bonner Springs, KS
Population 7,735
Tonganoxie, KS
Population 5,693
Leavenworth Demographics And Statistics
Population over time in Leavenworth
The current population in Leavenworth is 37,176. The population has increased 5.7% from 2010.
| Year | Population | % Change |
|---|---|---|
| 2023 | 37,176 | -0.0% |
| 2022 | 37,193 | -0.1% |
| 2021 | 37,216 | 3.0% |
| 2020 | 36,129 | 0.2% |
| 2019 | 36,064 | 0.2% |
| 2018 | 36,008 | 0.1% |
| 2017 | 35,958 | 0.0% |
| 2016 | 35,948 | 0.2% |
| 2015 | 35,861 | 0.3% |
| 2014 | 35,738 | 0.4% |
| 2013 | 35,586 | 0.4% |
| 2012 | 35,434 | 0.4% |
| 2011 | 35,300 | 0.4% |
| 2010 | 35,174 | - |
Race / Ethnicity in Leavenworth
Leavenworth is:
70.8% White with 26,331 White residents.
11.3% African American with 4,184 African American residents.
0.5% American Indian with 183 American Indian residents.
1.9% Asian with 711 Asian residents.
0.0% Hawaiian with 12 Hawaiian residents.
1.1% Other with 427 Other residents.
5.7% Two Or More with 2,108 Two Or More residents.
8.7% Hispanic with 3,220 Hispanic residents.
| Race | Leavenworth | KS | USA |
|---|---|---|---|
| White | 70.8% | 73.4% | 58.2% |
| African American | 11.3% | 5.3% | 12.0% |
| American Indian | 0.5% | 0.4% | 0.5% |
| Asian | 1.9% | 2.9% | 5.7% |
| Hawaiian | 0.0% | 0.1% | 0.2% |
| Other | 1.1% | 0.4% | 0.5% |
| Two Or More | 5.7% | 4.3% | 3.9% |
| Hispanic | 8.7% | 13.3% | 19.0% |
Gender in Leavenworth
Leavenworth is 44.2% female with 16,444 female residents.
Leavenworth is 55.8% male with 20,732 male residents.
| Gender | Leavenworth | KS | USA |
|---|---|---|---|
| Female | 44.2% | 49.8% | 50.5% |
| Male | 55.8% | 50.2% | 49.5% |
Highest level of educational attainment in Leavenworth for adults over 25
3.0% of adults in Leavenworth completed < 9th grade.
6.0% of adults in Leavenworth completed 9-12th grade.
26.0% of adults in Leavenworth completed high school / ged.
22.0% of adults in Leavenworth completed some college.
10.0% of adults in Leavenworth completed associate's degree.
19.0% of adults in Leavenworth completed bachelor's degree.
12.0% of adults in Leavenworth completed master's degree.
1.0% of adults in Leavenworth completed professional degree.
1.0% of adults in Leavenworth completed doctorate degree.
| Education | Leavenworth | KS | USA |
|---|---|---|---|
| < 9th Grade | 3.0% | 3.0% | 5.0% |
| 9-12th Grade | 6.0% | 5.0% | 6.0% |
| High School / GED | 26.0% | 26.0% | 26.0% |
| Some College | 22.0% | 22.0% | 19.0% |
| Associate's Degree | 10.0% | 9.0% | 9.0% |
| Bachelor's Degree | 19.0% | 22.0% | 21.0% |
| Master's Degree | 12.0% | 10.0% | 10.0% |
| Professional Degree | 1.0% | 2.0% | 2.0% |
| Doctorate Degree | 1.0% | 1.0% | 2.0% |
Household Income For Leavenworth, Kansas
5.5% of households in Leavenworth earn Less than $10,000.
3.2% of households in Leavenworth earn $10,000 to $14,999.
6.7% of households in Leavenworth earn $15,000 to $24,999.
8.4% of households in Leavenworth earn $25,000 to $34,999.
10.1% of households in Leavenworth earn $35,000 to $49,999.
19.3% of households in Leavenworth earn $50,000 to $74,999.
14.3% of households in Leavenworth earn $75,000 to $99,999.
17.7% of households in Leavenworth earn $100,000 to $149,999.
7.9% of households in Leavenworth earn $150,000 to $199,999.
6.9% of households in Leavenworth earn $200,000 or more.
| Income | Leavenworth | KS | USA |
|---|---|---|---|
| Less than $10,000 | 5.5% | 4.4% | 4.9% |
| $10,000 to $14,999 | 3.2% | 3.3% | 3.6% |
| $15,000 to $24,999 | 6.7% | 6.7% | 6.6% |
| $25,000 to $34,999 | 8.4% | 7.8% | 6.8% |
| $35,000 to $49,999 | 10.1% | 11.5% | 10.4% |
| $50,000 to $74,999 | 19.3% | 17.8% | 15.7% |
| $75,000 to $99,999 | 14.3% | 13.5% | 12.7% |
| $100,000 to $149,999 | 17.7% | 17.7% | 17.4% |
| $150,000 to $199,999 | 7.9% | 8.4% | 9.3% |
| $200,000 or more | 6.9% | 8.8% | 12.6% |


