Compare Topeka to…
Topeka SnackAbility
Overall SnackAbility
Crime in Topeka summary. We use data from the FBI to determine the crime rates in Topeka. Key points include:
There were 5,631 total crimes in Topeka in the last reporting year.
The overall crime rate per 100,000 people in Topeka is 4,499.2 / 100k people.
The violent crime rate per 100,000 people in Topeka is 856.5 / 100k people.
The property crime rate per 100,000 people in Topeka is 3,642.7 / 100k people.
Overall, crime in Topeka is 112.30% above the national average.
Total Crimes
Above National Average
Crime In Topeka Comparison Table
| Statistic | Count Raw |
Topeka / 100k People |
Kansas / 100k People |
National / 100k People |
|---|---|---|---|---|
| Total Crimes Per 100K | 5,631 | 4,499.2 | 2,395.1 | 2,119.2 |
| Violent Crime | 1,072 | 856.5 | 438.7 | 359.0 |
| Murder | 20 | 16.0 | 3.8 | 5.0 |
| Robbery | 101 | 80.7 | 30.9 | 61.0 |
| Aggravated Assault | 892 | 712.7 | 359.9 | 256.0 |
| Property Crime | 4,559 | 3,642.7 | 1,956.4 | 1,760.0 |
| Burglary | 798 | 637.6 | 261.6 | 229.0 |
| Larceny | 3,135 | 2,504.9 | 1,458.5 | 1,272.0 |
| Car Theft | 626 | 500.2 | 236.3 | 259.0 |
Source: FBI Uniform Crime Reporting (2024)
Cost of living in Topeka summary. We use data on the cost of living to determine how expensive it is to live in Topeka. Real estate prices drive most of the variance in cost of living around Kansas. Key points include:
The cost of living in Topeka is 86 with 100 being average.
The cost of living in Topeka is 0.9x lower than the national average.
The median home value in Topeka is $190,096.
The median income in Topeka is $56,956.
Topeka's Overall Cost Of Living
Lower Than The National Average
Cost Of Living In Topeka Comparison Table
| Living Expense | Topeka | Kansas | National Average |
|---|---|---|---|
| Overall | 86 | 91 | 100 |
| Services | 99 | 98 | 100 |
| Groceries | 98 | 97 | 100 |
| Health | 65 | 76 | 100 |
| Housing | 93 | 97 | 100 |
| Transportation | 93 | 93 | 100 |
| Utilities | 99 | 95 | 100 |
Source: Cost of living index, normalized to US average = 100
Topeka, KS Weather
The average high in Topeka is 65.5° and the average low is 44.5°.
There are 60.7 days of precipitation each year.
Expect an average of 36.9 inches of precipitation each year with 16.2 inches of snow.
| Stat | Topeka |
|---|---|
| Average Annual High | 65.5 |
| Average Annual Low | 44.5 |
| Annual Precipitation Days | 60.7 |
| Average Annual Precipitation | 36.9 |
| Average Annual Snowfall | 16.2 |
Average High
Days of Rain
Source: NOAA climate normals (30-year)
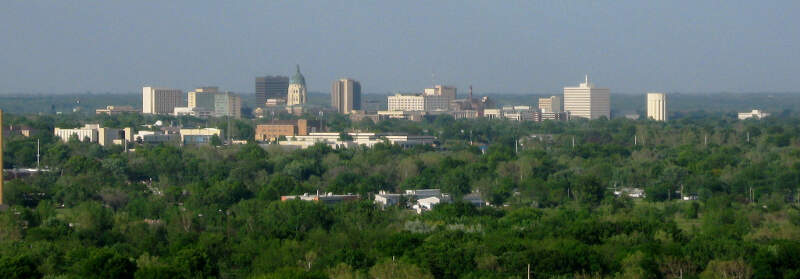
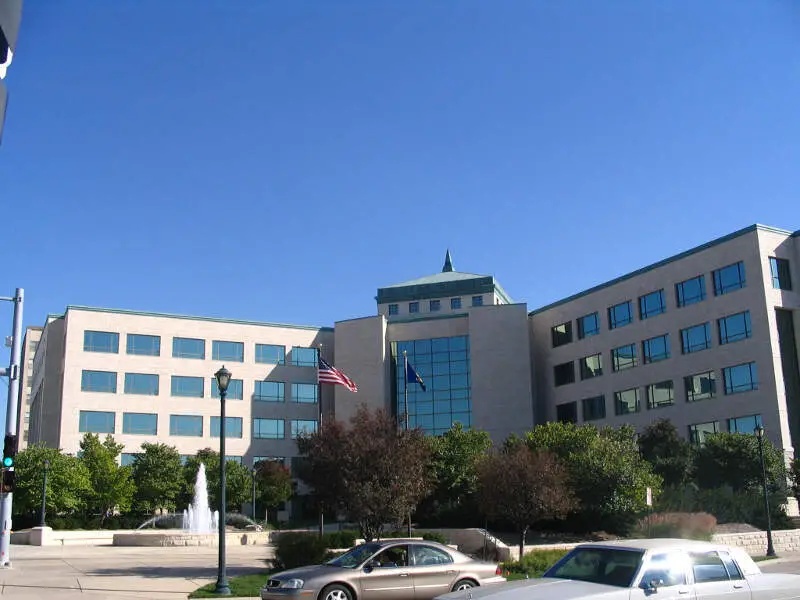
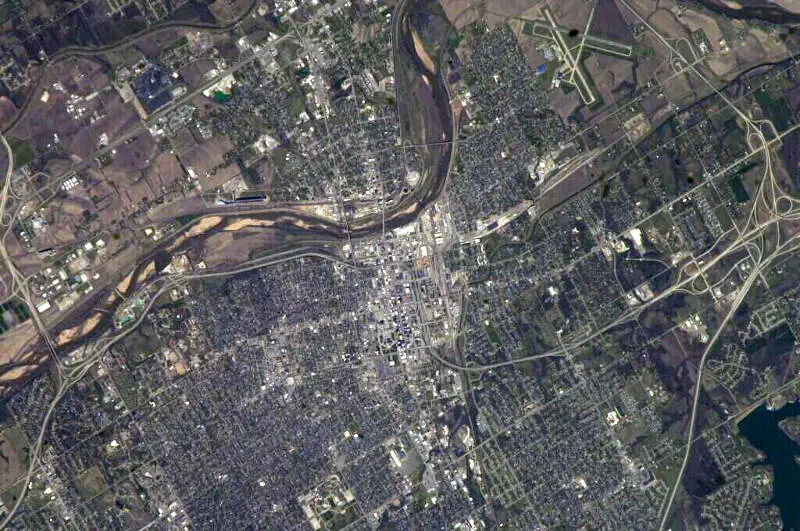
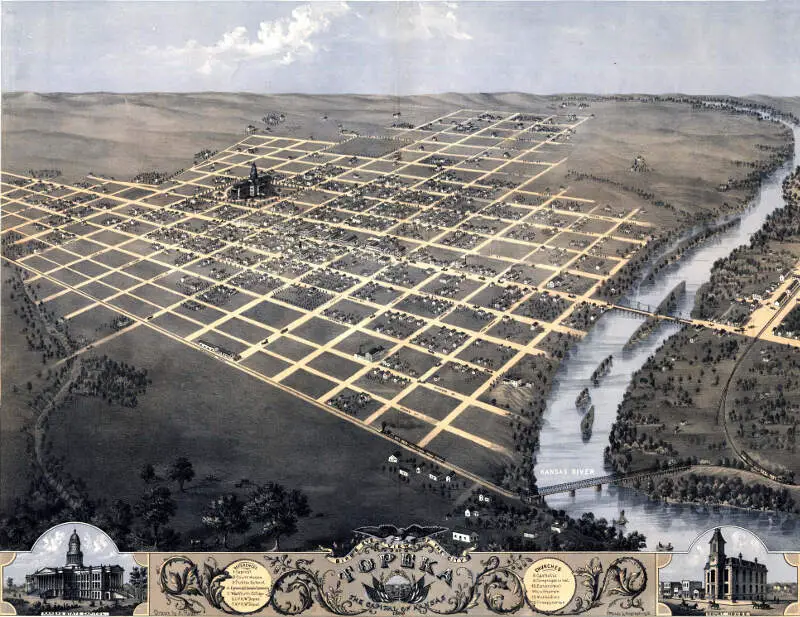
Topeka, KS Photos


2 Reviews & Comments About Topeka

The crime is really bad. There is always a murder, break in, or carjacking here in Topeka. The school system is terrible and the majority of the teachers dont truly care about the students.
There is not much to do here but we do have a pretty nice zoo and mall.
Topeka really s***s! There's so much murder and theft that goes on its ridiculous.
The good thing about Topeka is overall it had very convenient locations for their stores and mall.
Rankings & Articles For Topeka


Locations Around Topeka
Map Of Topeka, KS
Best Places Around Topeka
Olathe, KS
Population 145,057
Lenexa, KS
Population 58,384
Eudora, KS
Population 6,119
Shawnee, KS
Population 68,542
Gardner, KS
Population 24,526
Basehor, KS
Population 7,491
De Soto, KS
Population 6,414
Manhattan, KS
Population 54,239
Lansing, KS
Population 11,246
Lawrence, KS
Population 96,051
Topeka Demographics And Statistics
Population over time in Topeka
The current population in Topeka is 125,786. The population has decreased 0.3% from 2010.
| Year | Population | % Change |
|---|---|---|
| 2024 | 125,786 | -0.3% |
| 2023 | 126,103 | -0.3% |
| 2022 | 126,431 | -0.3% |
| 2021 | 126,802 | 0.8% |
| 2020 | 125,819 | -0.5% |
| 2019 | 126,397 | -0.4% |
| 2018 | 126,877 | -0.2% |
| 2017 | 127,139 | -0.3% |
| 2016 | 127,472 | -0.2% |
| 2015 | 127,672 | 0.0% |
| 2014 | 127,660 | 0.0% |
| 2013 | 127,625 | 0.2% |
| 2012 | 127,312 | 0.4% |
| 2011 | 126,842 | 0.6% |
| 2010 | 126,136 | - |
Race / Ethnicity in Topeka
See the full breakdown
Topeka is:
65.1% White with 81,862 White residents.
8.5% African American with 10,713 African American residents.
0.4% American Indian with 451 American Indian residents.
1.5% Asian with 1,937 Asian residents.
0.1% Hawaiian with 148 Hawaiian residents.
0.6% Other with 733 Other residents.
6.9% Two Or More with 8,638 Two Or More residents.
16.9% Hispanic with 21,304 Hispanic residents.
| Race | Topeka | KS | USA |
|---|---|---|---|
| White | 65.1% | 72.7% | 57.4% |
| African American | 8.5% | 5.2% | 11.9% |
| American Indian | 0.4% | 0.4% | 0.5% |
| Asian | 1.5% | 2.9% | 5.9% |
| Hawaiian | 0.1% | 0.1% | 0.2% |
| Other | 0.6% | 0.4% | 0.6% |
| Two Or More | 6.9% | 4.8% | 4.3% |
| Hispanic | 16.9% | 13.6% | 19.3% |
Gender in Topeka
See the full breakdown
Topeka is 51.8% female with 65,209 female residents.
Topeka is 48.2% male with 60,576 male residents.
| Gender | Topeka | KS | USA |
|---|---|---|---|
| Female | 51.8% | 49.8% | 50.5% |
| Male | 48.2% | 50.2% | 49.5% |
Highest level of educational attainment in Topeka for adults over 25
See the full breakdown
3.0% of adults in Topeka completed < 9th grade.
5.0% of adults in Topeka completed 9-12th grade.
32.0% of adults in Topeka completed high school / ged.
23.0% of adults in Topeka completed some college.
8.0% of adults in Topeka completed associate's degree.
18.0% of adults in Topeka completed bachelor's degree.
8.0% of adults in Topeka completed master's degree.
2.0% of adults in Topeka completed professional degree.
1.0% of adults in Topeka completed doctorate degree.
| Education | Topeka | KS | USA |
|---|---|---|---|
| < 9th Grade | 3.0% | 4.0% | 4.0% |
| 9-12th Grade | 5.0% | 5.0% | 6.0% |
| High School / GED | 32.0% | 25.0% | 26.0% |
| Some College | 23.0% | 22.0% | 19.0% |
| Associate's Degree | 8.0% | 9.0% | 9.0% |
| Bachelor's Degree | 18.0% | 22.0% | 22.0% |
| Master's Degree | 8.0% | 10.0% | 10.0% |
| Professional Degree | 2.0% | 2.0% | 2.0% |
| Doctorate Degree | 1.0% | 1.0% | 2.0% |
Household Income For Topeka, Kansas
See the full breakdown
7.4% of households in Topeka earn Less than $10,000.
4.2% of households in Topeka earn $10,000 to $14,999.
7.8% of households in Topeka earn $15,000 to $24,999.
9.8% of households in Topeka earn $25,000 to $34,999.
13.7% of households in Topeka earn $35,000 to $49,999.
19.0% of households in Topeka earn $50,000 to $74,999.
13.2% of households in Topeka earn $75,000 to $99,999.
14.2% of households in Topeka earn $100,000 to $149,999.
5.4% of households in Topeka earn $150,000 to $199,999.
5.2% of households in Topeka earn $200,000 or more.
| Income | Topeka | KS | USA |
|---|---|---|---|
| Less than $10,000 | 7.4% | 4.4% | 5.0% |
| $10,000 to $14,999 | 4.2% | 3.2% | 3.4% |
| $15,000 to $24,999 | 7.8% | 6.2% | 6.3% |
| $25,000 to $34,999 | 9.8% | 7.9% | 6.6% |
| $35,000 to $49,999 | 13.7% | 11.1% | 10.1% |
| $50,000 to $74,999 | 19.0% | 17.7% | 15.5% |
| $75,000 to $99,999 | 13.2% | 13.5% | 12.6% |
| $100,000 to $149,999 | 14.2% | 17.7% | 17.5% |
| $150,000 to $199,999 | 5.4% | 8.8% | 9.6% |
| $200,000 or more | 5.2% | 9.6% | 13.4% |
Source: U.S. Census ACS 5-year estimates (2024)


