Russellville SnackAbility
Overall SnackAbility
Crime in Russellville summary. We use data from the FBI to determine the crime rates in Russellville. Key points include:
There were 91 total crimes in Russellville in the last reporting year.
The overall crime rate per 100,000 people in Russellville is 1,218.2 / 100k people.
The violent crime rate per 100,000 people in Russellville is 93.7 / 100k people.
The property crime rate per 100,000 people in Russellville is 1,124.5 / 100k people.
Overall, crime in Russellville is -42.52% below the national average.
Total Crimes
Below National Average
Crime In Russellville Comparison Table
| Statistic | Count Raw |
Russellville / 100k People |
Kentucky / 100k People |
National / 100k People |
|---|---|---|---|---|
| Total Crimes Per 100K | 91 | 1,218.2 | 1,563.0 | 2,119.2 |
| Violent Crime | 7 | 93.7 | 213.1 | 359.0 |
| Murder | 0 | 0.0 | 6.1 | 5.0 |
| Robbery | 1 | 13.4 | 35.1 | 61.0 |
| Aggravated Assault | 3 | 40.2 | 139.5 | 256.0 |
| Property Crime | 84 | 1,124.5 | 1,349.9 | 1,760.0 |
| Burglary | 13 | 174.0 | 193.6 | 229.0 |
| Larceny | 69 | 923.7 | 930.2 | 1,272.0 |
| Car Theft | 2 | 26.8 | 226.2 | 259.0 |
Source: FBI Uniform Crime Reporting (2024)
Cost of living in Russellville summary. We use data on the cost of living to determine how expensive it is to live in Russellville. Real estate prices drive most of the variance in cost of living around Kentucky. Key points include:
The cost of living in Russellville is 86 with 100 being average.
The cost of living in Russellville is 0.9x lower than the national average.
The median home value in Russellville is $187,675.
The median income in Russellville is $45,484.
Russellville's Overall Cost Of Living
Lower Than The National Average
Cost Of Living In Russellville Comparison Table
| Living Expense | Russellville | Kentucky | National Average |
|---|---|---|---|
| Overall | 86 | 89 | 100 |
| Services | 98 | 100 | 100 |
| Groceries | 96 | 98 | 100 |
| Health | 55 | 68 | 100 |
| Housing | 92 | 98 | 100 |
| Transportation | 91 | 95 | 100 |
| Utilities | 90 | 96 | 100 |
Source: Cost of living index, normalized to US average = 100
Russellville, KY Weather
The average high in Russellville is 68.3° and the average low is 46.4°.
There are 78.2 days of precipitation each year.
Expect an average of 50.7 inches of precipitation each year with 5.4 inches of snow.
| Stat | Russellville |
|---|---|
| Average Annual High | 68.3 |
| Average Annual Low | 46.4 |
| Annual Precipitation Days | 78.2 |
| Average Annual Precipitation | 50.7 |
| Average Annual Snowfall | 5.4 |
Average High
Days of Rain
Source: NOAA climate normals (30-year)
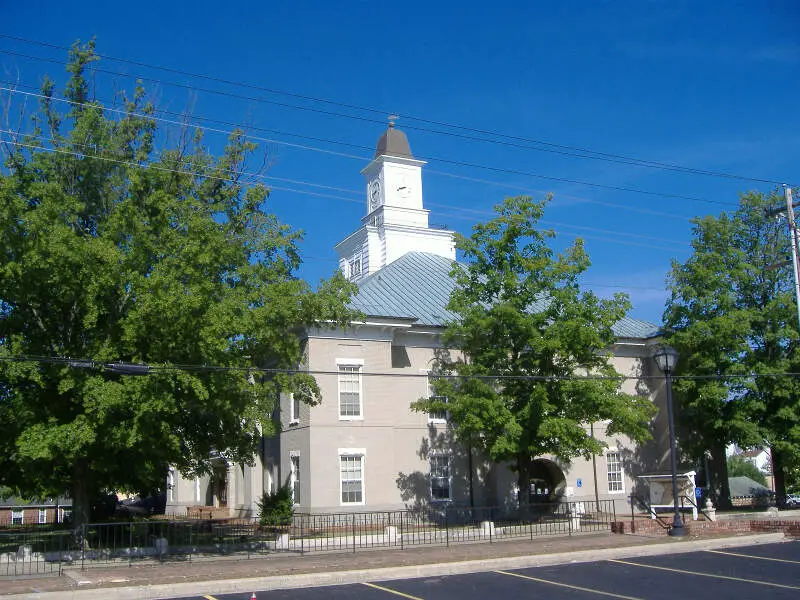
Russellville, KY Photos
1 Reviews & Comments About Russellville

We have a lot of people that get arrested for met here and Other Drugs there's a lot of people that are on welfare we have people that are on Medicaid and stuff and now the governor he cut a lot of programs we can't get if your low income if your on Medicaid you can't get vision coverage or you can Dentistry covers no more and if you're a diabetic like I'm that's s***s
The good thing here is there's a lot of good Christian people here in lot of good church that's a lot of people that care about you
Rankings & Articles For Russellville


Locations Around Russellville
Map Of Russellville, KY
Best Places Around Russellville
Green Hill, TN
Population 6,866
Mount Juliet, TN
Population 42,073
Hendersonville, TN
Population 63,091
White House, TN
Population 14,631
Bowling Green, KY
Population 75,388
Millersville, TN
Population 5,836
Gallatin, TN
Population 48,532
Greenbrier, TN
Population 6,971
Portland, TN
Population 13,449
Russellville Demographics And Statistics
Population over time in Russellville
The current population in Russellville is 7,316. The population has increased 4.3% from 2010.
| Year | Population | % Change |
|---|---|---|
| 2024 | 7,316 | 1.0% |
| 2023 | 7,244 | 0.8% |
| 2022 | 7,186 | 1.7% |
| 2021 | 7,068 | 0.2% |
| 2020 | 7,056 | 0.2% |
| 2019 | 7,039 | 0.4% |
| 2018 | 7,008 | -0.1% |
| 2017 | 7,015 | 0.2% |
| 2016 | 6,998 | -0.2% |
| 2015 | 7,015 | 0.2% |
| 2014 | 6,998 | -0.1% |
| 2013 | 7,003 | 0.3% |
| 2012 | 6,979 | -0.3% |
| 2011 | 7,000 | -0.2% |
| 2010 | 7,015 | - |
Race / Ethnicity in Russellville
See the full breakdown
Russellville is:
80.0% White with 5,854 White residents.
9.7% African American with 707 African American residents.
0.3% American Indian with 20 American Indian residents.
0.4% Asian with 28 Asian residents.
0.0% Hawaiian with 0 Hawaiian residents.
0.1% Other with 4 Other residents.
3.6% Two Or More with 265 Two Or More residents.
6.0% Hispanic with 438 Hispanic residents.
| Race | Russellville | KY | USA |
|---|---|---|---|
| White | 80.0% | 81.5% | 57.4% |
| African American | 9.7% | 7.6% | 11.9% |
| American Indian | 0.3% | 0.1% | 0.5% |
| Asian | 0.4% | 1.6% | 5.9% |
| Hawaiian | 0.0% | 0.1% | 0.2% |
| Other | 0.1% | 0.3% | 0.6% |
| Two Or More | 3.6% | 3.9% | 4.3% |
| Hispanic | 6.0% | 5.0% | 19.3% |
Gender in Russellville
See the full breakdown
Russellville is 53.0% female with 3,879 female residents.
Russellville is 47.0% male with 3,436 male residents.
| Gender | Russellville | KY | USA |
|---|---|---|---|
| Female | 53.0% | 50.5% | 50.5% |
| Male | 47.0% | 49.5% | 49.5% |
Highest level of educational attainment in Russellville for adults over 25
See the full breakdown
4.0% of adults in Russellville completed < 9th grade.
8.0% of adults in Russellville completed 9-12th grade.
42.0% of adults in Russellville completed high school / ged.
24.0% of adults in Russellville completed some college.
8.0% of adults in Russellville completed associate's degree.
10.0% of adults in Russellville completed bachelor's degree.
4.0% of adults in Russellville completed master's degree.
0.0% of adults in Russellville completed professional degree.
0.0% of adults in Russellville completed doctorate degree.
| Education | Russellville | KY | USA |
|---|---|---|---|
| < 9th Grade | 4.0% | 4.0% | 4.0% |
| 9-12th Grade | 8.0% | 7.0% | 6.0% |
| High School / GED | 42.0% | 33.0% | 26.0% |
| Some College | 24.0% | 20.0% | 19.0% |
| Associate's Degree | 8.0% | 9.0% | 9.0% |
| Bachelor's Degree | 10.0% | 16.0% | 22.0% |
| Master's Degree | 4.0% | 8.0% | 10.0% |
| Professional Degree | 0.0% | 2.0% | 2.0% |
| Doctorate Degree | 0.0% | 1.0% | 2.0% |
Household Income For Russellville, Kentucky
See the full breakdown
6.5% of households in Russellville earn Less than $10,000.
12.7% of households in Russellville earn $10,000 to $14,999.
7.5% of households in Russellville earn $15,000 to $24,999.
6.6% of households in Russellville earn $25,000 to $34,999.
21.8% of households in Russellville earn $35,000 to $49,999.
12.7% of households in Russellville earn $50,000 to $74,999.
13.7% of households in Russellville earn $75,000 to $99,999.
12.0% of households in Russellville earn $100,000 to $149,999.
2.3% of households in Russellville earn $150,000 to $199,999.
4.1% of households in Russellville earn $200,000 or more.
| Income | Russellville | KY | USA |
|---|---|---|---|
| Less than $10,000 | 6.5% | 6.1% | 5.0% |
| $10,000 to $14,999 | 12.7% | 5.2% | 3.4% |
| $15,000 to $24,999 | 7.5% | 8.3% | 6.3% |
| $25,000 to $34,999 | 6.6% | 8.3% | 6.6% |
| $35,000 to $49,999 | 21.8% | 12.1% | 10.1% |
| $50,000 to $74,999 | 12.7% | 17.1% | 15.5% |
| $75,000 to $99,999 | 13.7% | 12.8% | 12.6% |
| $100,000 to $149,999 | 12.0% | 15.9% | 17.5% |
| $150,000 to $199,999 | 2.3% | 7.1% | 9.6% |
| $200,000 or more | 4.1% | 7.2% | 13.4% |
Source: U.S. Census ACS 5-year estimates (2024)


