Compare Baltimore to…
Baltimore SnackAbility
Overall SnackAbility
Crime in Baltimore summary. We use data from the FBI to determine the crime rates in Baltimore. Key points include:
There were 32,656 total crimes in Baltimore in the last reporting year.
The overall crime rate per 100,000 people in Baltimore is 5,763.2 / 100k people.
The violent crime rate per 100,000 people in Baltimore is 1,606.2 / 100k people.
The property crime rate per 100,000 people in Baltimore is 4,157.0 / 100k people.
Overall, crime in Baltimore is 171.95% above the national average.
Total Crimes
Above National Average
Crime In Baltimore Comparison Table
| Statistic | Count Raw |
Baltimore / 100k People |
Maryland / 100k People |
National / 100k People |
|---|---|---|---|---|
| Total Crimes Per 100K | 32,656 | 5,763.2 | 2,470.0 | 2,119.2 |
| Violent Crime | 9,101 | 1,606.2 | 420.4 | 359.0 |
| Murder | 197 | 34.8 | 7.2 | 5.0 |
| Robbery | 3,248 | 573.2 | 123.2 | 61.0 |
| Aggravated Assault | 5,330 | 940.6 | 257.0 | 256.0 |
| Property Crime | 23,555 | 4,157.0 | 2,049.6 | 1,760.0 |
| Burglary | 2,968 | 523.8 | 190.0 | 229.0 |
| Larceny | 14,630 | 2,581.9 | 1,446.8 | 1,272.0 |
| Car Theft | 5,957 | 1,051.3 | 412.8 | 259.0 |
Source: FBI Uniform Crime Reporting (2024)
Cost of living in Baltimore summary. We use data on the cost of living to determine how expensive it is to live in Baltimore. Real estate prices drive most of the variance in cost of living around Maryland. Key points include:
The cost of living in Baltimore is 109 with 100 being average.
The cost of living in Baltimore is 1.1x higher than the national average.
The median home value in Baltimore is $188,101.
The median income in Baltimore is $62,177.
Baltimore's Overall Cost Of Living
Higher Than The National Average
Cost Of Living In Baltimore Comparison Table
| Living Expense | Baltimore | Maryland | National Average |
|---|---|---|---|
| Overall | 109 | 121 | 100 |
| Services | 109 | 104 | 100 |
| Groceries | 114 | 107 | 100 |
| Health | 99 | 152 | 100 |
| Housing | 114 | 109 | 100 |
| Transportation | 112 | 108 | 100 |
| Utilities | 109 | 109 | 100 |
Source: Cost of living index, normalized to US average = 100
Baltimore, MD Weather
The average high in Baltimore is 65.8° and the average low is 47.0°.
There are 70.2 days of precipitation each year.
Expect an average of 44.9 inches of precipitation each year with 19.2 inches of snow.
| Stat | Baltimore |
|---|---|
| Average Annual High | 65.8 |
| Average Annual Low | 47.0 |
| Annual Precipitation Days | 70.2 |
| Average Annual Precipitation | 44.9 |
| Average Annual Snowfall | 19.2 |
Average High
Days of Rain
Source: NOAA climate normals (30-year)
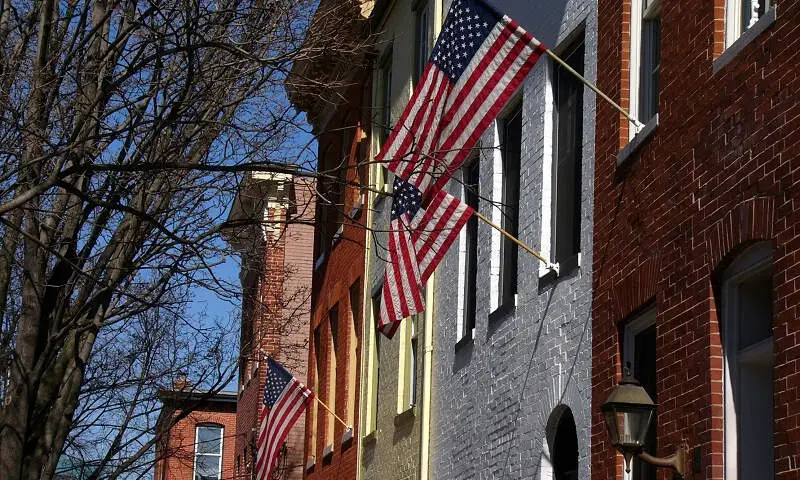
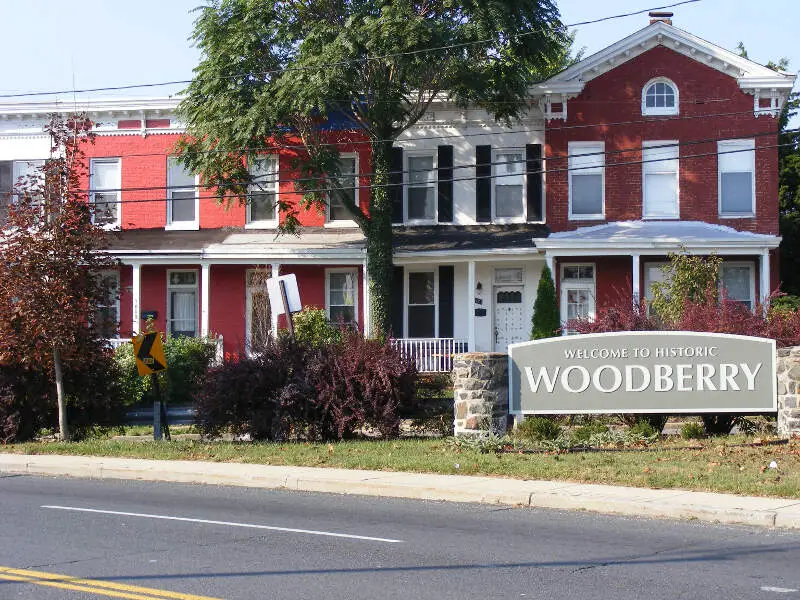
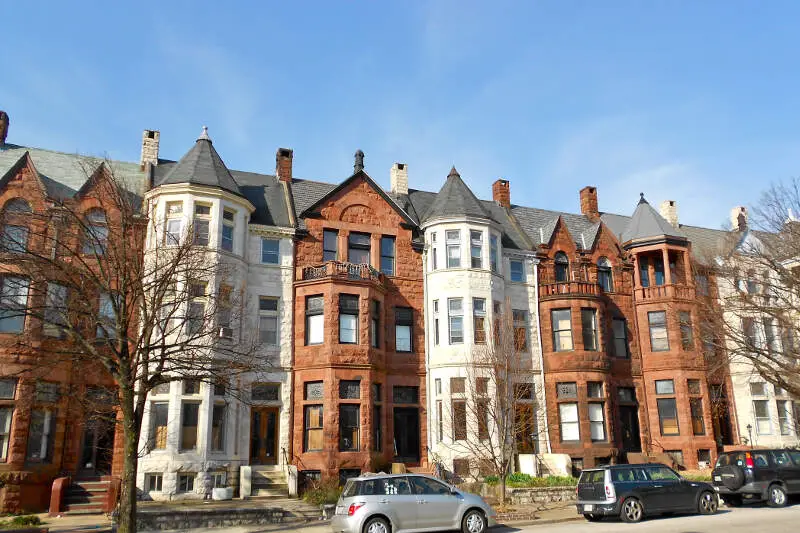
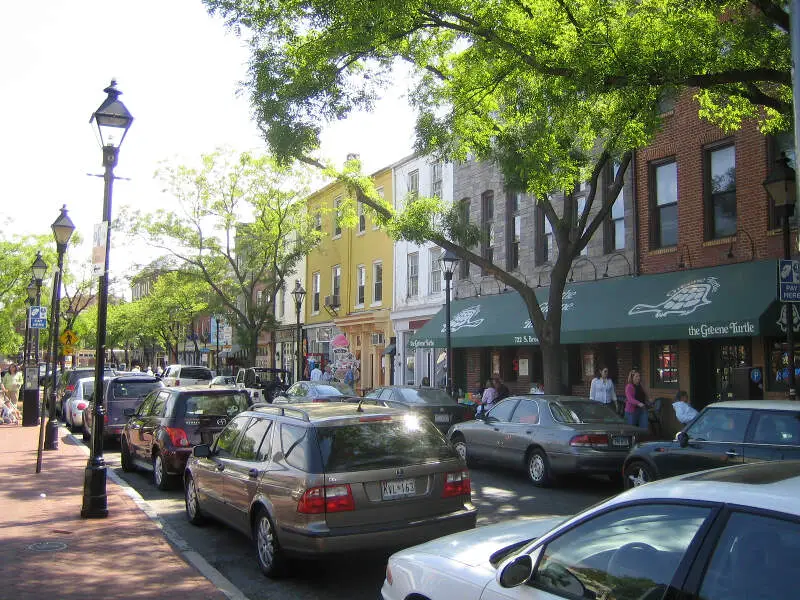
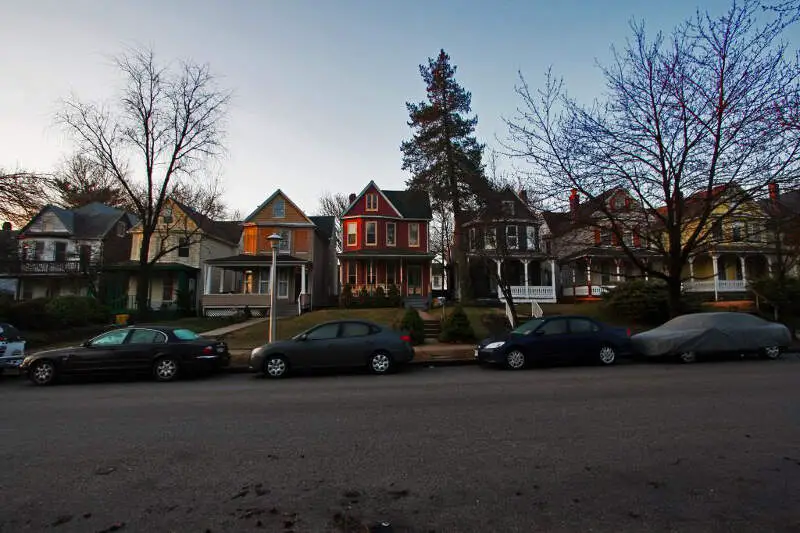
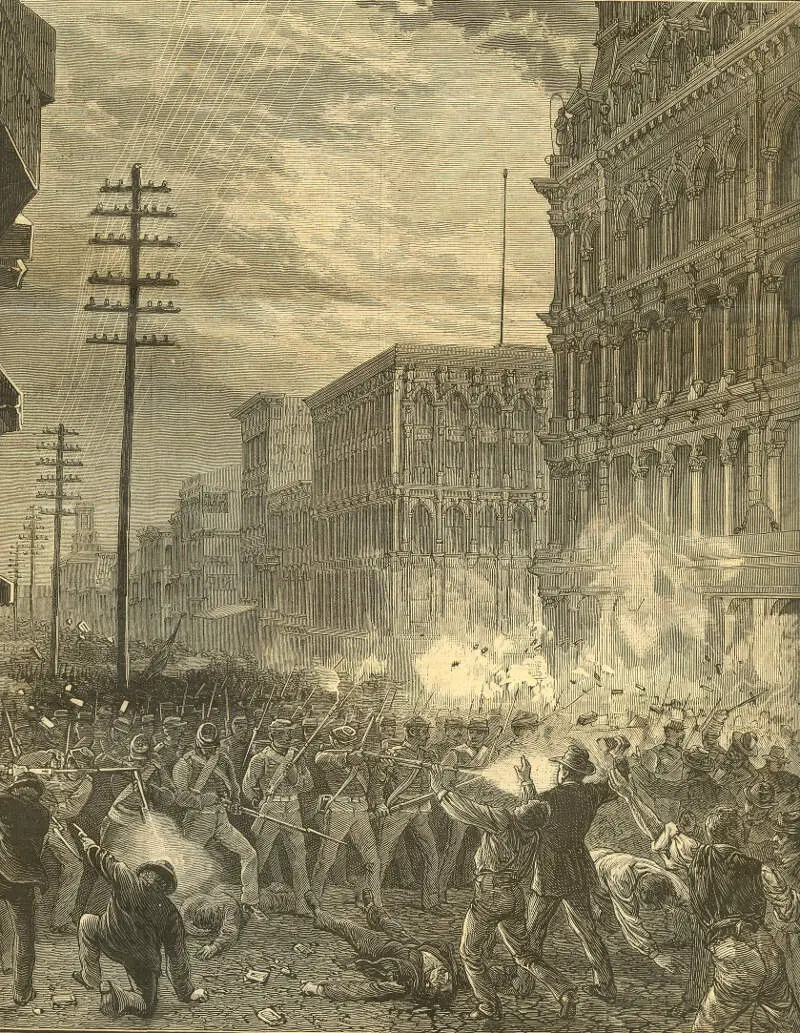
Baltimore, MD Photos


7 Reviews & Comments About Baltimore

I live in Baltimore County I know so many people who have died from h****n overdoes. People from Maryland are sooooo proud. In reality, we are pretty much mediocre in a lot of ways
I live in Baltimore and it's not as bad as you think
The crime is very bad in this city. I love the culture and my neighbors but the extremely high crime rate is making me seriously consider on moving out.
The violence and the robbery. The restaurants in the city are amazing though.
I used to visit Baltimore frequently, but will now not visit due to crime. it is no longer same to take my family there to see the sights, watch a team play, or visit the Inner Harbor.
The crime and packs of kids running around causing trouble are the primary reason I no longer visit the city.
The city has a crime problem, but the citizens of Baltimore are actively working to make their city better. Inner Harbor is beautiful, of course, but the city as a whole is crammed with interesting places to eat and shop. Some of the markets are excellent for people-watching as well as shopping.
Patapsco flea market! Seafood! Ram's Head Live! Reasonable parking rates!
This city is filthy and crime ridden. Lots of drug addicts and homeless people roaming the streets. You cannot go out at night without fearing that you are in danger of being mugged or worse.
What stood out most to me is the massive quantities of homeless people. They were everywhere. Begging on the side of the streets and even in the middle of traffic.
Too many bad folks and the city does not care about it.
Black people and their negative impact to the city.
Rankings & Articles For Baltimore


Locations Around Baltimore
Map Of Baltimore, MD
Best Places Around Baltimore
Ilchester, MD
Population 28,364
North Laurel, MD
Population 25,563
Columbia, MD
Population 104,338
Scaggsville, MD
Population 10,564
Savage, MD
Population 8,239
Severna Park, MD
Population 40,228
Cape St. Claire, MD
Population 9,236
Elkridge, MD
Population 26,283
Fallston, MD
Population 10,013
Arnold, MD
Population 24,303
Baltimore Demographics And Statistics
Population over time in Baltimore
The current population in Baltimore is 573,243. The population has decreased 7.6% from 2010.
| Year | Population | % Change |
|---|---|---|
| 2024 | 573,243 | -0.7% |
| 2023 | 577,193 | -1.3% |
| 2022 | 584,548 | -1.3% |
| 2021 | 592,211 | -1.7% |
| 2020 | 602,274 | -1.1% |
| 2019 | 609,032 | -0.9% |
| 2018 | 614,700 | -0.8% |
| 2017 | 619,796 | -0.2% |
| 2016 | 621,000 | -0.2% |
| 2015 | 622,454 | 0.0% |
| 2014 | 622,271 | 0.1% |
| 2013 | 621,445 | 0.1% |
| 2012 | 620,644 | 0.1% |
| 2011 | 620,210 | -0.1% |
| 2010 | 620,538 | - |
Race / Ethnicity in Baltimore
See the full breakdown
Baltimore is:
26.0% White with 148,914 White residents.
58.5% African American with 335,489 African American residents.
0.2% American Indian with 881 American Indian residents.
2.6% Asian with 14,688 Asian residents.
0.0% Hawaiian with 131 Hawaiian residents.
0.6% Other with 3,556 Other residents.
3.9% Two Or More with 22,566 Two Or More residents.
8.2% Hispanic with 47,018 Hispanic residents.
| Race | Baltimore | MD | USA |
|---|---|---|---|
| White | 26.0% | 46.6% | 57.4% |
| African American | 58.5% | 28.9% | 11.9% |
| American Indian | 0.2% | 0.1% | 0.5% |
| Asian | 2.6% | 6.5% | 5.9% |
| Hawaiian | 0.0% | 0.0% | 0.2% |
| Other | 0.6% | 0.7% | 0.6% |
| Two Or More | 3.9% | 4.6% | 4.3% |
| Hispanic | 8.2% | 12.5% | 19.3% |
Gender in Baltimore
See the full breakdown
Baltimore is 53.5% female with 306,638 female residents.
Baltimore is 46.5% male with 266,605 male residents.
| Gender | Baltimore | MD | USA |
|---|---|---|---|
| Female | 53.5% | 51.3% | 50.5% |
| Male | 46.5% | 48.7% | 49.5% |
Highest level of educational attainment in Baltimore for adults over 25
See the full breakdown
5.0% of adults in Baltimore completed < 9th grade.
8.0% of adults in Baltimore completed 9-12th grade.
28.0% of adults in Baltimore completed high school / ged.
18.0% of adults in Baltimore completed some college.
5.0% of adults in Baltimore completed associate's degree.
18.0% of adults in Baltimore completed bachelor's degree.
12.0% of adults in Baltimore completed master's degree.
3.0% of adults in Baltimore completed professional degree.
3.0% of adults in Baltimore completed doctorate degree.
| Education | Baltimore | MD | USA |
|---|---|---|---|
| < 9th Grade | 5.0% | 4.0% | 4.0% |
| 9-12th Grade | 8.0% | 5.0% | 6.0% |
| High School / GED | 28.0% | 23.0% | 26.0% |
| Some College | 18.0% | 17.0% | 19.0% |
| Associate's Degree | 5.0% | 7.0% | 9.0% |
| Bachelor's Degree | 18.0% | 23.0% | 22.0% |
| Master's Degree | 12.0% | 15.0% | 10.0% |
| Professional Degree | 3.0% | 3.0% | 2.0% |
| Doctorate Degree | 3.0% | 3.0% | 2.0% |
Household Income For Baltimore, Maryland
See the full breakdown
9.0% of households in Baltimore earn Less than $10,000.
6.4% of households in Baltimore earn $10,000 to $14,999.
7.9% of households in Baltimore earn $15,000 to $24,999.
7.5% of households in Baltimore earn $25,000 to $34,999.
11.1% of households in Baltimore earn $35,000 to $49,999.
15.9% of households in Baltimore earn $50,000 to $74,999.
11.8% of households in Baltimore earn $75,000 to $99,999.
13.8% of households in Baltimore earn $100,000 to $149,999.
7.2% of households in Baltimore earn $150,000 to $199,999.
9.3% of households in Baltimore earn $200,000 or more.
| Income | Baltimore | MD | USA |
|---|---|---|---|
| Less than $10,000 | 9.0% | 4.4% | 5.0% |
| $10,000 to $14,999 | 6.4% | 2.4% | 3.4% |
| $15,000 to $24,999 | 7.9% | 4.3% | 6.3% |
| $25,000 to $34,999 | 7.5% | 4.9% | 6.6% |
| $35,000 to $49,999 | 11.1% | 7.5% | 10.1% |
| $50,000 to $74,999 | 15.9% | 12.8% | 15.5% |
| $75,000 to $99,999 | 11.8% | 11.9% | 12.6% |
| $100,000 to $149,999 | 13.8% | 18.9% | 17.5% |
| $150,000 to $199,999 | 7.2% | 12.5% | 9.6% |
| $200,000 or more | 9.3% | 20.3% | 13.4% |
Source: U.S. Census ACS 5-year estimates (2024)


