Easton SnackAbility
Overall SnackAbility
Crime in Easton summary. We use data from the FBI to determine the crime rates in Easton. Key points include:
There were 411 total crimes in Easton in the last reporting year.
The overall crime rate per 100,000 people in Easton is 2,380.1 / 100k people.
The violent crime rate per 100,000 people in Easton is 399.6 / 100k people.
The property crime rate per 100,000 people in Easton is 1,980.5 / 100k people.
Overall, crime in Easton is 12.31% above the national average.
Total Crimes
Above National Average
Crime In Easton Comparison Table
| Statistic | Count Raw |
Easton / 100k People |
Maryland / 100k People |
National / 100k People |
|---|---|---|---|---|
| Total Crimes Per 100K | 411 | 2,380.1 | 2,470.0 | 2,119.2 |
| Violent Crime | 69 | 399.6 | 420.4 | 359.0 |
| Murder | 0 | 0.0 | 7.2 | 5.0 |
| Robbery | 8 | 46.3 | 123.2 | 61.0 |
| Aggravated Assault | 54 | 312.7 | 257.0 | 256.0 |
| Property Crime | 342 | 1,980.5 | 2,049.6 | 1,760.0 |
| Burglary | 29 | 167.9 | 190.0 | 229.0 |
| Larceny | 289 | 1,673.6 | 1,446.8 | 1,272.0 |
| Car Theft | 24 | 139.0 | 412.8 | 259.0 |
Source: FBI Uniform Crime Reporting (2024)
Cost of living in Easton summary. We use data on the cost of living to determine how expensive it is to live in Easton. Real estate prices drive most of the variance in cost of living around Maryland. Key points include:
The cost of living in Easton is 119 with 100 being average.
The cost of living in Easton is 1.2x higher than the national average.
The median home value in Easton is $451,055.
The median income in Easton is $74,653.
Easton's Overall Cost Of Living
Higher Than The National Average
Cost Of Living In Easton Comparison Table
| Living Expense | Easton | Maryland | National Average |
|---|---|---|---|
| Overall | 119 | 121 | 100 |
| Services | 103 | 104 | 100 |
| Groceries | 108 | 107 | 100 |
| Health | 138 | 152 | 100 |
| Housing | 110 | 109 | 100 |
| Transportation | 108 | 108 | 100 |
| Utilities | 107 | 109 | 100 |
Source: Cost of living index, normalized to US average = 100
Easton, MD Weather
The average high in Easton is 67.0° and the average low is 47.2°.
There are 75.6 days of precipitation each year.
Expect an average of 44.0 inches of precipitation each year with 13.1 inches of snow.
| Stat | Easton |
|---|---|
| Average Annual High | 67.0 |
| Average Annual Low | 47.2 |
| Annual Precipitation Days | 75.6 |
| Average Annual Precipitation | 44.0 |
| Average Annual Snowfall | 13.1 |
Average High
Days of Rain
Source: NOAA climate normals (30-year)
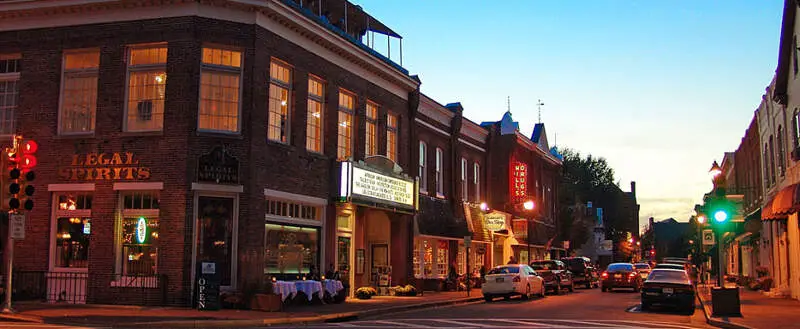
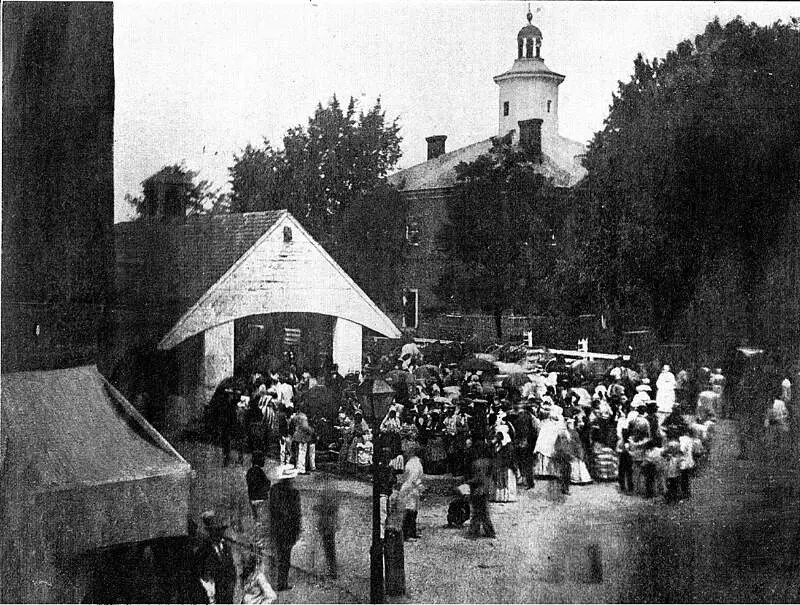
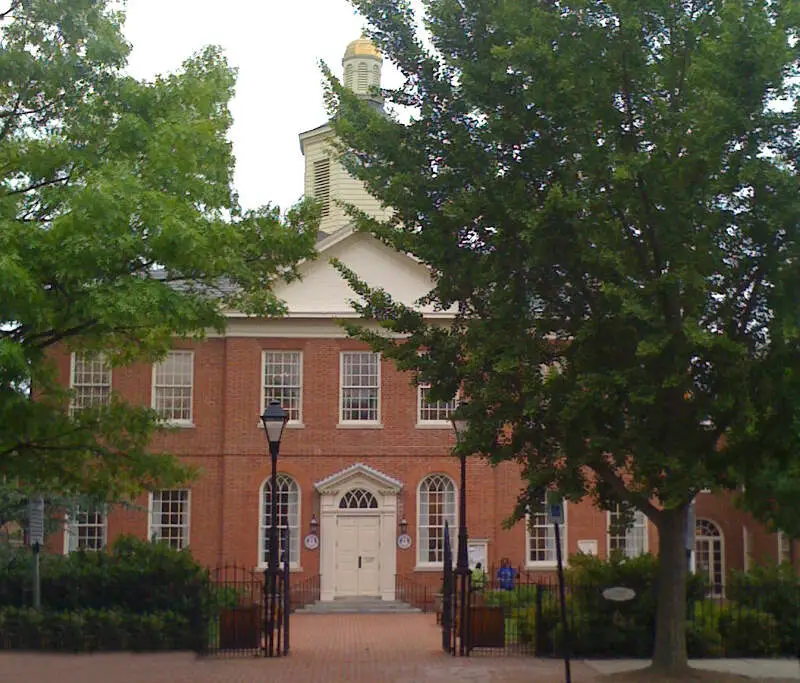
Easton, MD Photos
Rankings & Articles For Easton


Locations Around Easton
Map Of Easton, MD
Best Places Around Easton
Ilchester, MD
Population 28,364
North Laurel, MD
Population 25,563
Savage, MD
Population 8,239
Severna Park, MD
Population 40,228
Crofton, MD
Population 29,549
Bowie, MD
Population 57,926
Cape St. Claire, MD
Population 9,236
Elkridge, MD
Population 26,283
Arnold, MD
Population 24,303
Annapolis Neck, MD
Population 12,032
Easton Demographics And Statistics
Population over time in Easton
The current population in Easton is 17,308. The population has increased 13.1% from 2010.
| Year | Population | % Change |
|---|---|---|
| 2024 | 17,308 | 0.6% |
| 2023 | 17,202 | 0.5% |
| 2022 | 17,118 | 1.2% |
| 2021 | 16,912 | 1.9% |
| 2020 | 16,589 | -0.0% |
| 2019 | 16,591 | 0.2% |
| 2018 | 16,551 | -0.3% |
| 2017 | 16,606 | -0.2% |
| 2016 | 16,637 | 0.2% |
| 2015 | 16,599 | 0.4% |
| 2014 | 16,541 | 1.4% |
| 2013 | 16,318 | 1.7% |
| 2012 | 16,044 | 3.0% |
| 2011 | 15,572 | 1.7% |
| 2010 | 15,310 | - |
Race / Ethnicity in Easton
See the full breakdown
Easton is:
64.3% White with 11,129 White residents.
15.7% African American with 2,719 African American residents.
0.0% American Indian with 2 American Indian residents.
2.1% Asian with 361 Asian residents.
0.1% Hawaiian with 19 Hawaiian residents.
0.4% Other with 65 Other residents.
2.8% Two Or More with 493 Two Or More residents.
14.6% Hispanic with 2,520 Hispanic residents.
| Race | Easton | MD | USA |
|---|---|---|---|
| White | 64.3% | 46.6% | 57.4% |
| African American | 15.7% | 28.9% | 11.9% |
| American Indian | 0.0% | 0.1% | 0.5% |
| Asian | 2.1% | 6.5% | 5.9% |
| Hawaiian | 0.1% | 0.0% | 0.2% |
| Other | 0.4% | 0.7% | 0.6% |
| Two Or More | 2.8% | 4.6% | 4.3% |
| Hispanic | 14.6% | 12.5% | 19.3% |
Gender in Easton
See the full breakdown
Easton is 54.2% female with 9,383 female residents.
Easton is 45.8% male with 7,925 male residents.
| Gender | Easton | MD | USA |
|---|---|---|---|
| Female | 54.2% | 51.3% | 50.5% |
| Male | 45.8% | 48.7% | 49.5% |
Highest level of educational attainment in Easton for adults over 25
See the full breakdown
6.0% of adults in Easton completed < 9th grade.
4.0% of adults in Easton completed 9-12th grade.
24.0% of adults in Easton completed high school / ged.
20.0% of adults in Easton completed some college.
8.0% of adults in Easton completed associate's degree.
22.0% of adults in Easton completed bachelor's degree.
9.0% of adults in Easton completed master's degree.
4.0% of adults in Easton completed professional degree.
3.0% of adults in Easton completed doctorate degree.
| Education | Easton | MD | USA |
|---|---|---|---|
| < 9th Grade | 6.0% | 4.0% | 4.0% |
| 9-12th Grade | 4.0% | 5.0% | 6.0% |
| High School / GED | 24.0% | 23.0% | 26.0% |
| Some College | 20.0% | 17.0% | 19.0% |
| Associate's Degree | 8.0% | 7.0% | 9.0% |
| Bachelor's Degree | 22.0% | 23.0% | 22.0% |
| Master's Degree | 9.0% | 15.0% | 10.0% |
| Professional Degree | 4.0% | 3.0% | 2.0% |
| Doctorate Degree | 3.0% | 3.0% | 2.0% |
Household Income For Easton, Maryland
See the full breakdown
4.7% of households in Easton earn Less than $10,000.
3.8% of households in Easton earn $10,000 to $14,999.
6.7% of households in Easton earn $15,000 to $24,999.
9.2% of households in Easton earn $25,000 to $34,999.
11.3% of households in Easton earn $35,000 to $49,999.
14.5% of households in Easton earn $50,000 to $74,999.
12.9% of households in Easton earn $75,000 to $99,999.
16.3% of households in Easton earn $100,000 to $149,999.
8.7% of households in Easton earn $150,000 to $199,999.
11.8% of households in Easton earn $200,000 or more.
| Income | Easton | MD | USA |
|---|---|---|---|
| Less than $10,000 | 4.7% | 4.4% | 5.0% |
| $10,000 to $14,999 | 3.8% | 2.4% | 3.4% |
| $15,000 to $24,999 | 6.7% | 4.3% | 6.3% |
| $25,000 to $34,999 | 9.2% | 4.9% | 6.6% |
| $35,000 to $49,999 | 11.3% | 7.5% | 10.1% |
| $50,000 to $74,999 | 14.5% | 12.8% | 15.5% |
| $75,000 to $99,999 | 12.9% | 11.9% | 12.6% |
| $100,000 to $149,999 | 16.3% | 18.9% | 17.5% |
| $150,000 to $199,999 | 8.7% | 12.5% | 9.6% |
| $200,000 or more | 11.8% | 20.3% | 13.4% |
Source: U.S. Census ACS 5-year estimates (2024)


