Grand Haven SnackAbility
Overall SnackAbility
Crime in Grand Haven summary. We use data from the FBI to determine the crime rates in Grand Haven. Key points include:
There were 125 total crimes in Grand Haven in the last reporting year.
The overall crime rate per 100,000 people in Grand Haven is 1,136.7 / 100k people.
The violent crime rate per 100,000 people in Grand Haven is 209.1 / 100k people.
The property crime rate per 100,000 people in Grand Haven is 927.5 / 100k people.
Overall, crime in Grand Haven is -46.36% below the national average.
Total Crimes
Below National Average
Crime In Grand Haven Comparison Table
| Statistic | Count Raw |
Grand Haven / 100k People |
Michigan / 100k People |
National / 100k People |
|---|---|---|---|---|
| Total Crimes Per 100K | 125 | 1,136.7 | 1,813.2 | 2,119.2 |
| Violent Crime | 23 | 209.1 | 434.3 | 359.0 |
| Murder | 0 | 0.0 | 5.2 | 5.0 |
| Robbery | 0 | 0.0 | 31.3 | 61.0 |
| Aggravated Assault | 20 | 181.9 | 341.3 | 256.0 |
| Property Crime | 102 | 927.5 | 1,378.9 | 1,760.0 |
| Burglary | 3 | 27.3 | 184.2 | 229.0 |
| Larceny | 90 | 818.4 | 963.6 | 1,272.0 |
| Car Theft | 9 | 81.8 | 231.0 | 259.0 |
Source: FBI Uniform Crime Reporting (2024)
Cost of living in Grand Haven summary. We use data on the cost of living to determine how expensive it is to live in Grand Haven. Real estate prices drive most of the variance in cost of living around Michigan. Key points include:
The cost of living in Grand Haven is 94 with 100 being average.
The cost of living in Grand Haven is 0.9x lower than the national average.
The median home value in Grand Haven is $391,796.
The median income in Grand Haven is $60,669.
Grand Haven's Overall Cost Of Living
Lower Than The National Average
Cost Of Living In Grand Haven Comparison Table
| Living Expense | Grand Haven | Michigan | National Average |
|---|---|---|---|
| Overall | 94 | 91 | 100 |
| Services | 98 | 97 | 100 |
| Groceries | 98 | 98 | 100 |
| Health | 93 | 75 | 100 |
| Housing | 94 | 98 | 100 |
| Transportation | 104 | 101 | 100 |
| Utilities | 95 | 98 | 100 |
Source: Cost of living index, normalized to US average = 100
Grand Haven, MI Weather
The average high in Grand Haven is 57.3° and the average low is 39.3°.
There are 74.4 days of precipitation each year.
Expect an average of 35.9 inches of precipitation each year with 72.6 inches of snow.
| Stat | Grand Haven |
|---|---|
| Average Annual High | 57.3 |
| Average Annual Low | 39.3 |
| Annual Precipitation Days | 74.4 |
| Average Annual Precipitation | 35.9 |
| Average Annual Snowfall | 72.6 |
Average High
Days of Rain
Source: NOAA climate normals (30-year)
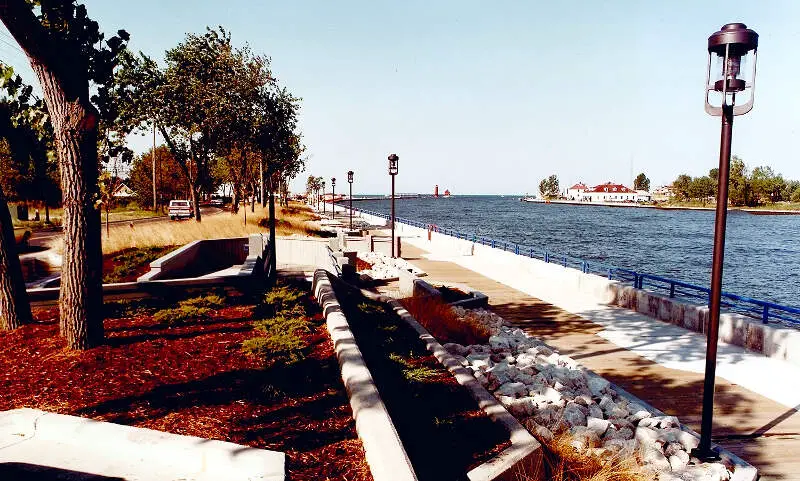
Grand Haven, MI Photos


1 Reviews & Comments About Grand Haven

It is such a nice little beach town on Lake Michigan. Only a 2, 2.5 hour drive from Metro Detroit and makes you feel like you're on vacation.
The nice beach, water and little downtown. The only bad thing was that it was really crowded.
Rankings & Articles For Grand Haven


Locations Around Grand Haven
Map Of Grand Haven, MI
Best Places Around Grand Haven
Allendale, MI
Population 26,679
Zeeland, MI
Population 5,665
Norton Shores, MI
Population 25,041
Muskegon Heights, MI
Population 9,841
Muskegon, MI
Population 37,226
Grand Haven Demographics And Statistics
Population over time in Grand Haven
The current population in Grand Haven is 10,996. The population has increased 3.3% from 2010.
| Year | Population | % Change |
|---|---|---|
| 2024 | 10,996 | 0.3% |
| 2023 | 10,966 | 0.0% |
| 2022 | 10,961 | 0.2% |
| 2021 | 10,935 | -0.5% |
| 2020 | 10,991 | -0.0% |
| 2019 | 10,994 | 0.2% |
| 2018 | 10,974 | 0.4% |
| 2017 | 10,929 | 0.7% |
| 2016 | 10,853 | 0.3% |
| 2015 | 10,819 | 1.2% |
| 2014 | 10,687 | 0.9% |
| 2013 | 10,594 | 0.5% |
| 2012 | 10,541 | -0.3% |
| 2011 | 10,569 | -0.7% |
| 2010 | 10,640 | - |
Race / Ethnicity in Grand Haven
See the full breakdown
Grand Haven is:
85.5% White with 9,402 White residents.
1.0% African American with 105 African American residents.
0.0% American Indian with 0 American Indian residents.
2.1% Asian with 235 Asian residents.
0.0% Hawaiian with 0 Hawaiian residents.
0.3% Other with 30 Other residents.
5.2% Two Or More with 570 Two Or More residents.
5.9% Hispanic with 654 Hispanic residents.
| Race | Grand Haven | MI | USA |
|---|---|---|---|
| White | 85.5% | 72.4% | 57.4% |
| African American | 1.0% | 13.1% | 11.9% |
| American Indian | 0.0% | 0.3% | 0.5% |
| Asian | 2.1% | 3.4% | 5.9% |
| Hawaiian | 0.0% | 0.0% | 0.2% |
| Other | 0.3% | 0.5% | 0.6% |
| Two Or More | 5.2% | 4.5% | 4.3% |
| Hispanic | 5.9% | 5.9% | 19.3% |
Gender in Grand Haven
See the full breakdown
Grand Haven is 56.9% female with 6,252 female residents.
Grand Haven is 43.1% male with 4,744 male residents.
| Gender | Grand Haven | MI | USA |
|---|---|---|---|
| Female | 56.9% | 50.4% | 50.5% |
| Male | 43.1% | 49.6% | 49.5% |
Highest level of educational attainment in Grand Haven for adults over 25
See the full breakdown
2.0% of adults in Grand Haven completed < 9th grade.
3.0% of adults in Grand Haven completed 9-12th grade.
28.0% of adults in Grand Haven completed high school / ged.
23.0% of adults in Grand Haven completed some college.
8.0% of adults in Grand Haven completed associate's degree.
24.0% of adults in Grand Haven completed bachelor's degree.
10.0% of adults in Grand Haven completed master's degree.
1.0% of adults in Grand Haven completed professional degree.
1.0% of adults in Grand Haven completed doctorate degree.
| Education | Grand Haven | MI | USA |
|---|---|---|---|
| < 9th Grade | 2.0% | 3.0% | 4.0% |
| 9-12th Grade | 3.0% | 5.0% | 6.0% |
| High School / GED | 28.0% | 28.0% | 26.0% |
| Some College | 23.0% | 22.0% | 19.0% |
| Associate's Degree | 8.0% | 10.0% | 9.0% |
| Bachelor's Degree | 24.0% | 20.0% | 22.0% |
| Master's Degree | 10.0% | 9.0% | 10.0% |
| Professional Degree | 1.0% | 2.0% | 2.0% |
| Doctorate Degree | 1.0% | 1.0% | 2.0% |
Household Income For Grand Haven, Michigan
See the full breakdown
10.4% of households in Grand Haven earn Less than $10,000.
3.2% of households in Grand Haven earn $10,000 to $14,999.
8.9% of households in Grand Haven earn $15,000 to $24,999.
7.7% of households in Grand Haven earn $25,000 to $34,999.
12.6% of households in Grand Haven earn $35,000 to $49,999.
15.8% of households in Grand Haven earn $50,000 to $74,999.
13.2% of households in Grand Haven earn $75,000 to $99,999.
12.7% of households in Grand Haven earn $100,000 to $149,999.
7.0% of households in Grand Haven earn $150,000 to $199,999.
8.4% of households in Grand Haven earn $200,000 or more.
| Income | Grand Haven | MI | USA |
|---|---|---|---|
| Less than $10,000 | 10.4% | 5.2% | 5.0% |
| $10,000 to $14,999 | 3.2% | 3.8% | 3.4% |
| $15,000 to $24,999 | 8.9% | 6.8% | 6.3% |
| $25,000 to $34,999 | 7.7% | 7.3% | 6.6% |
| $35,000 to $49,999 | 12.6% | 11.4% | 10.1% |
| $50,000 to $74,999 | 15.8% | 16.8% | 15.5% |
| $75,000 to $99,999 | 13.2% | 13.2% | 12.6% |
| $100,000 to $149,999 | 12.7% | 17.3% | 17.5% |
| $150,000 to $199,999 | 7.0% | 8.6% | 9.6% |
| $200,000 or more | 8.4% | 9.5% | 13.4% |
Source: U.S. Census ACS 5-year estimates (2024)


