Muskegon SnackAbility
Overall SnackAbility
Crime in Muskegon summary. We use data from the FBI to determine the crime rates in Muskegon. Key points include:
There were 1,426 total crimes in Muskegon in the last reporting year.
The overall crime rate per 100,000 people in Muskegon is 3,734.2 / 100k people.
The violent crime rate per 100,000 people in Muskegon is 738.5 / 100k people.
The property crime rate per 100,000 people in Muskegon is 2,995.7 / 100k people.
Overall, crime in Muskegon is 76.20% above the national average.
Total Crimes
Above National Average
Crime In Muskegon Comparison Table
| Statistic | Count Raw |
Muskegon / 100k People |
Michigan / 100k People |
National / 100k People |
|---|---|---|---|---|
| Total Crimes Per 100K | 1,426 | 3,734.2 | 1,813.2 | 2,119.2 |
| Violent Crime | 282 | 738.5 | 434.3 | 359.0 |
| Murder | 6 | 15.7 | 5.2 | 5.0 |
| Robbery | 26 | 68.1 | 31.3 | 61.0 |
| Aggravated Assault | 220 | 576.1 | 341.3 | 256.0 |
| Property Crime | 1,144 | 2,995.7 | 1,378.9 | 1,760.0 |
| Burglary | 173 | 453.0 | 184.2 | 229.0 |
| Larceny | 841 | 2,202.3 | 963.6 | 1,272.0 |
| Car Theft | 130 | 340.4 | 231.0 | 259.0 |
Source: FBI Uniform Crime Reporting (2024)
Cost of living in Muskegon summary. We use data on the cost of living to determine how expensive it is to live in Muskegon. Real estate prices drive most of the variance in cost of living around Michigan. Key points include:
The cost of living in Muskegon is 82 with 100 being average.
The cost of living in Muskegon is 0.8x lower than the national average.
The median home value in Muskegon is $184,017.
The median income in Muskegon is $44,735.
Muskegon's Overall Cost Of Living
Lower Than The National Average
Cost Of Living In Muskegon Comparison Table
| Living Expense | Muskegon | Michigan | National Average |
|---|---|---|---|
| Overall | 82 | 91 | 100 |
| Services | 99 | 97 | 100 |
| Groceries | 99 | 98 | 100 |
| Health | 54 | 75 | 100 |
| Housing | 96 | 98 | 100 |
| Transportation | 102 | 101 | 100 |
| Utilities | 91 | 98 | 100 |
Source: Cost of living index, normalized to US average = 100
Muskegon, MI Weather
The average high in Muskegon is 56.5° and the average low is 39.3°.
There are 74.1 days of precipitation each year.
Expect an average of 34.2 inches of precipitation each year with 86.1 inches of snow.
| Stat | Muskegon |
|---|---|
| Average Annual High | 56.5 |
| Average Annual Low | 39.3 |
| Annual Precipitation Days | 74.1 |
| Average Annual Precipitation | 34.2 |
| Average Annual Snowfall | 86.1 |
Average High
Days of Rain
Source: NOAA climate normals (30-year)
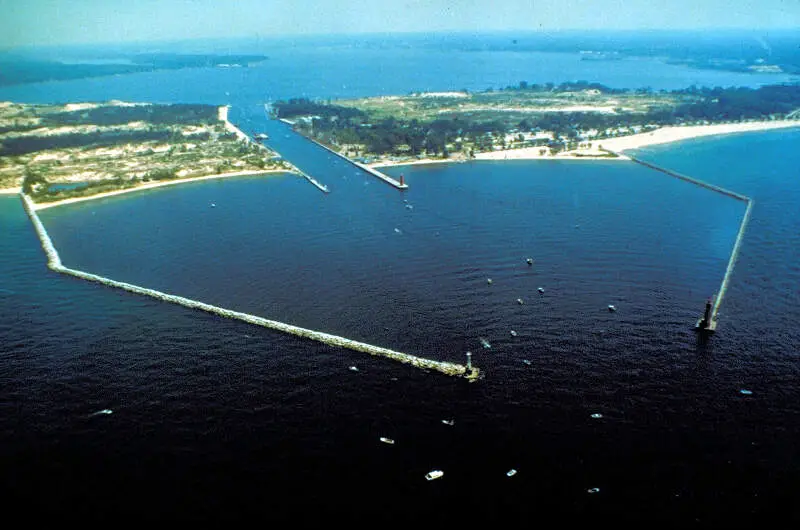
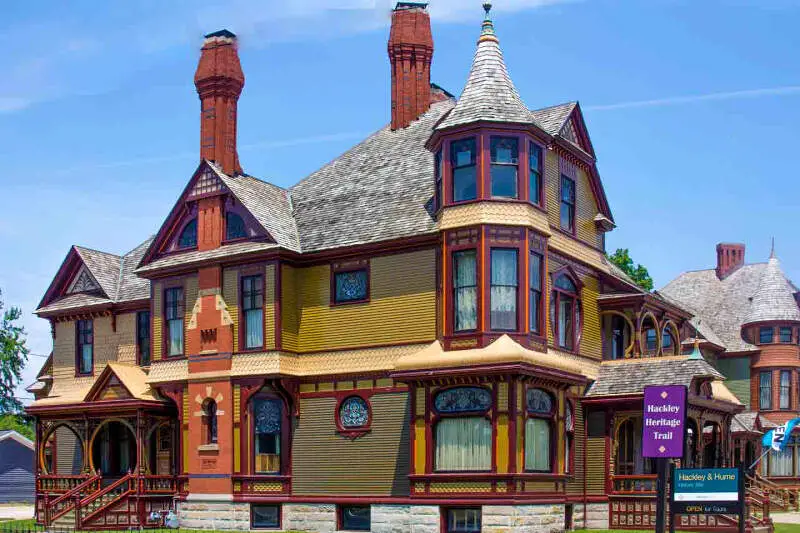
Muskegon, MI Photos
3 Reviews & Comments About Muskegon

Small town with so much potential. Just need the right voices and right leafers to pick this city up amd make it great.
Good:Every generation has become more aware socially, political, and within themselves
I'VE LIVED IN MUSKEGON ALL MY LIFE 73 YEARS NOW.....I'LL ADMIT IT HAS CHANGED QUITE A BIT SINCE I WAS A CHILD....BUT I SURE DON'T SEE IT AS THE # 1 GHETTO CITY IN OUR STATE...WE HAVE THE BIG LAKE MICHIGAN ON OUR SHORES PLUS MANY OTHER BEAUTIFUL SMALL LAKES VERY NEAR TO THE CITY...BUT I DO ADMIT OUR DOWNTOWN IS REALLY NOT MUCH ANYMORE SINCE THEY BUILT THE MALL DOWN THERE..AND THEN TORE IT DOWN.....I'VE ONLY BEEN AWAY FROM HERE FOR 2 YEARS IN THE MILITARY...BUT IT WILL ALWAYS BE HOME TO ME AND CERTAINLY NOT THE STATES #1 GHETTO...NOW MUSKEGON HEIGHTS JUST A COUPLE MILES DOWN THE ROAD....IS A WHOLE DIFFERENT PLACE...ALWAYS HAS BEEN....#1 DANGEROUS AND PROBABLY #1 GHETTO ALSO
TOO MANY GOOD THINGS TO MENTION....I WILL NEVER LIVE ANYWHERE ELSE!
I agree. I have lived in Muskegon area for 40 years. I have lived in most the ghetto neighborhoods at one point in time and I am still alive! I have even lived in Muskegon Hts a couple of times. Actually, in those 40 years, I really never lived anywhere but the Ghetto referenced neighborhoods. I now live just outside of Muskegon, through no choice of mine, and I still go to Muskegon to shop, eat dinner, visit friends and have never been, killed, raped or stabbed!!!! BTW I also have a college degree in Marketing/Management from Muskegon Community College and have owned my own business twice. It is not as bad as folks are making it out to be!
Rankings & Articles For Muskegon


Locations Around Muskegon
Map Of Muskegon, MI
Best Places Around Muskegon
East Grand Rapids, MI
Population 11,445
Forest Hills, MI
Population 28,695
Jenison, MI
Population 17,582
Byron Center, MI
Population 7,403
Hudsonville, MI
Population 7,769
Rockford, MI
Population 6,218
Northview, MI
Population 15,268
Wyoming, MI
Population 77,353
Kentwood, MI
Population 54,296
Cutlerville, MI
Population 18,780
Muskegon Demographics And Statistics
Population over time in Muskegon
The current population in Muskegon is 37,226. The population has decreased 4.6% from 2010.
| Year | Population | % Change |
|---|---|---|
| 2024 | 37,226 | 0.1% |
| 2023 | 37,203 | -2.8% |
| 2022 | 38,286 | 1.7% |
| 2021 | 37,632 | 0.8% |
| 2020 | 37,317 | -0.8% |
| 2019 | 37,633 | -0.9% |
| 2018 | 37,969 | -0.6% |
| 2017 | 38,189 | 0.3% |
| 2016 | 38,086 | 0.6% |
| 2015 | 37,861 | 0.1% |
| 2014 | 37,822 | 0.4% |
| 2013 | 37,666 | -1.0% |
| 2012 | 38,061 | -1.8% |
| 2011 | 38,775 | -0.6% |
| 2010 | 39,023 | - |
Race / Ethnicity in Muskegon
See the full breakdown
Muskegon is:
52.3% White with 19,451 White residents.
28.9% African American with 10,759 African American residents.
0.4% American Indian with 158 American Indian residents.
0.6% Asian with 237 Asian residents.
0.1% Hawaiian with 29 Hawaiian residents.
0.0% Other with 4 Other residents.
7.8% Two Or More with 2,895 Two Or More residents.
9.9% Hispanic with 3,693 Hispanic residents.
| Race | Muskegon | MI | USA |
|---|---|---|---|
| White | 52.3% | 72.4% | 57.4% |
| African American | 28.9% | 13.1% | 11.9% |
| American Indian | 0.4% | 0.3% | 0.5% |
| Asian | 0.6% | 3.4% | 5.9% |
| Hawaiian | 0.1% | 0.0% | 0.2% |
| Other | 0.0% | 0.5% | 0.6% |
| Two Or More | 7.8% | 4.5% | 4.3% |
| Hispanic | 9.9% | 5.9% | 19.3% |
Gender in Muskegon
See the full breakdown
Muskegon is 49.5% female with 18,444 female residents.
Muskegon is 50.5% male with 18,782 male residents.
| Gender | Muskegon | MI | USA |
|---|---|---|---|
| Female | 49.5% | 50.4% | 50.5% |
| Male | 50.5% | 49.6% | 49.5% |
Highest level of educational attainment in Muskegon for adults over 25
See the full breakdown
3.0% of adults in Muskegon completed < 9th grade.
9.0% of adults in Muskegon completed 9-12th grade.
38.0% of adults in Muskegon completed high school / ged.
23.0% of adults in Muskegon completed some college.
11.0% of adults in Muskegon completed associate's degree.
12.0% of adults in Muskegon completed bachelor's degree.
3.0% of adults in Muskegon completed master's degree.
1.0% of adults in Muskegon completed professional degree.
0.0% of adults in Muskegon completed doctorate degree.
| Education | Muskegon | MI | USA |
|---|---|---|---|
| < 9th Grade | 3.0% | 3.0% | 4.0% |
| 9-12th Grade | 9.0% | 5.0% | 6.0% |
| High School / GED | 38.0% | 28.0% | 26.0% |
| Some College | 23.0% | 22.0% | 19.0% |
| Associate's Degree | 11.0% | 10.0% | 9.0% |
| Bachelor's Degree | 12.0% | 20.0% | 22.0% |
| Master's Degree | 3.0% | 9.0% | 10.0% |
| Professional Degree | 1.0% | 2.0% | 2.0% |
| Doctorate Degree | 0.0% | 1.0% | 2.0% |
Household Income For Muskegon, Michigan
See the full breakdown
7.3% of households in Muskegon earn Less than $10,000.
8.4% of households in Muskegon earn $10,000 to $14,999.
14.5% of households in Muskegon earn $15,000 to $24,999.
10.9% of households in Muskegon earn $25,000 to $34,999.
12.8% of households in Muskegon earn $35,000 to $49,999.
17.7% of households in Muskegon earn $50,000 to $74,999.
13.7% of households in Muskegon earn $75,000 to $99,999.
9.9% of households in Muskegon earn $100,000 to $149,999.
2.8% of households in Muskegon earn $150,000 to $199,999.
1.9% of households in Muskegon earn $200,000 or more.
| Income | Muskegon | MI | USA |
|---|---|---|---|
| Less than $10,000 | 7.3% | 5.2% | 5.0% |
| $10,000 to $14,999 | 8.4% | 3.8% | 3.4% |
| $15,000 to $24,999 | 14.5% | 6.8% | 6.3% |
| $25,000 to $34,999 | 10.9% | 7.3% | 6.6% |
| $35,000 to $49,999 | 12.8% | 11.4% | 10.1% |
| $50,000 to $74,999 | 17.7% | 16.8% | 15.5% |
| $75,000 to $99,999 | 13.7% | 13.2% | 12.6% |
| $100,000 to $149,999 | 9.9% | 17.3% | 17.5% |
| $150,000 to $199,999 | 2.8% | 8.6% | 9.6% |
| $200,000 or more | 1.9% | 9.5% | 13.4% |
Source: U.S. Census ACS 5-year estimates (2024)


