Marshall SnackAbility
Overall SnackAbility
Crime in Marshall summary. We use data from the FBI to determine the crime rates in Marshall. Key points include:
There were 94 total crimes in Marshall in the last reporting year.
The overall crime rate per 100,000 people in Marshall is 1,390.9 / 100k people.
The violent crime rate per 100,000 people in Marshall is 266.4 / 100k people.
The property crime rate per 100,000 people in Marshall is 1,124.6 / 100k people.
Overall, crime in Marshall is -34.37% below the national average.
Total Crimes
Below National Average
Crime In Marshall Comparison Table
| Statistic | Count Raw |
Marshall / 100k People |
Michigan / 100k People |
National / 100k People |
|---|---|---|---|---|
| Total Crimes Per 100K | 94 | 1,390.9 | 1,813.2 | 2,119.2 |
| Violent Crime | 18 | 266.4 | 434.3 | 359.0 |
| Murder | 0 | 0.0 | 5.2 | 5.0 |
| Robbery | 1 | 14.8 | 31.3 | 61.0 |
| Aggravated Assault | 10 | 148.0 | 341.3 | 256.0 |
| Property Crime | 76 | 1,124.6 | 1,378.9 | 1,760.0 |
| Burglary | 12 | 177.6 | 184.2 | 229.0 |
| Larceny | 59 | 873.0 | 963.6 | 1,272.0 |
| Car Theft | 5 | 74.0 | 231.0 | 259.0 |
Source: FBI Uniform Crime Reporting (2024)
Cost of living in Marshall summary. We use data on the cost of living to determine how expensive it is to live in Marshall. Real estate prices drive most of the variance in cost of living around Michigan. Key points include:
The cost of living in Marshall is 91 with 100 being average.
The cost of living in Marshall is 0.9x lower than the national average.
The median home value in Marshall is $240,469.
The median income in Marshall is $76,050.
Marshall's Overall Cost Of Living
Lower Than The National Average
Cost Of Living In Marshall Comparison Table
| Living Expense | Marshall | Michigan | National Average |
|---|---|---|---|
| Overall | 91 | 91 | 100 |
| Services | 97 | 97 | 100 |
| Groceries | 98 | 98 | 100 |
| Health | 75 | 75 | 100 |
| Housing | 92 | 98 | 100 |
| Transportation | 103 | 101 | 100 |
| Utilities | 97 | 98 | 100 |
Source: Cost of living index, normalized to US average = 100
Marshall, MI Weather
The average high in Marshall is 57.6° and the average low is 38.9°.
There are 75.7 days of precipitation each year.
Expect an average of 36.4 inches of precipitation each year with 48.8 inches of snow.
| Stat | Marshall |
|---|---|
| Average Annual High | 57.6 |
| Average Annual Low | 38.9 |
| Annual Precipitation Days | 75.7 |
| Average Annual Precipitation | 36.4 |
| Average Annual Snowfall | 48.8 |
Average High
Days of Rain
Source: NOAA climate normals (30-year)
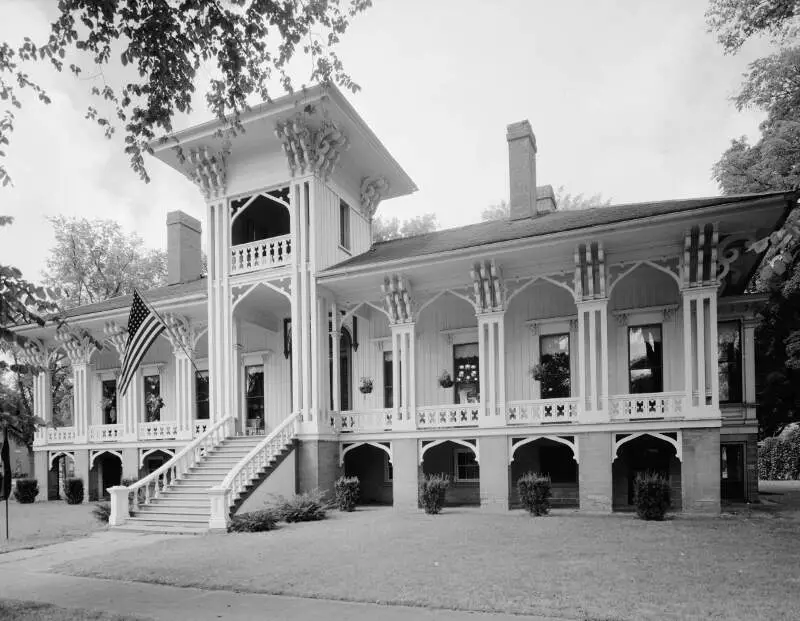
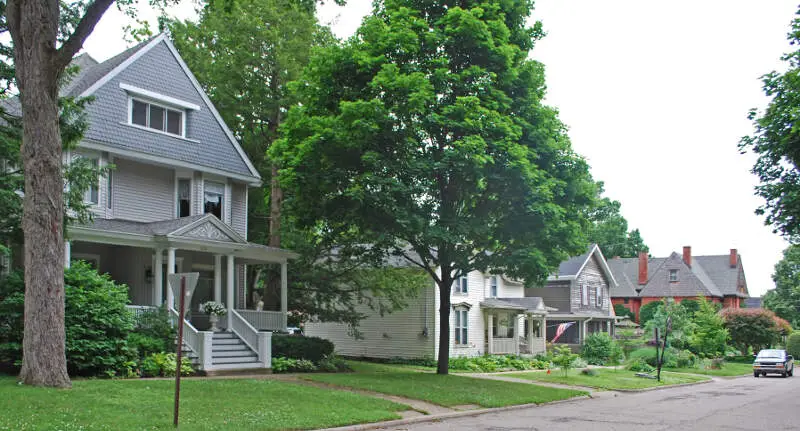
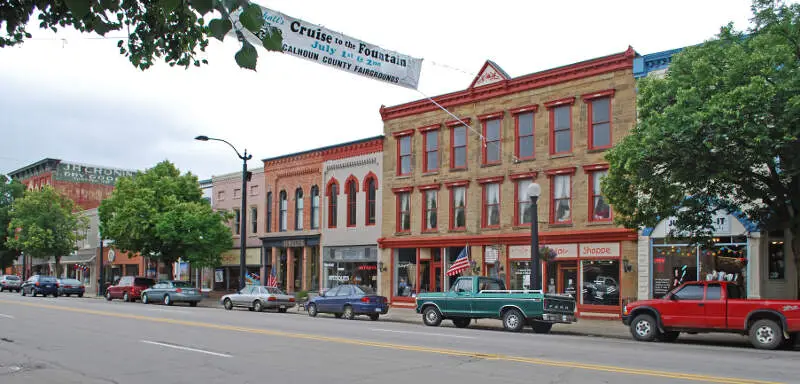
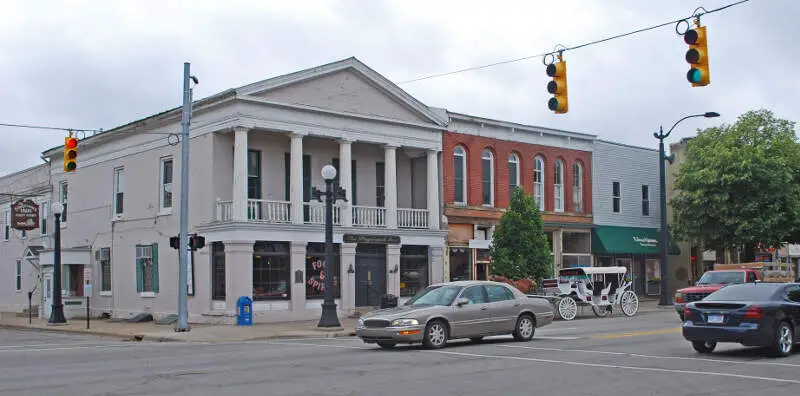
Marshall, MI Photos
Rankings & Articles For Marshall


Locations Around Marshall
Map Of Marshall, MI
Best Places Around Marshall
Okemos, MI
Population 26,396
Portage, MI
Population 49,259
Westwood, MI
Population 8,867
Holt, MI
Population 25,316
Comstock Northwest, MI
Population 5,391
Mason, MI
Population 8,249
Haslett, MI
Population 18,559
Grand Ledge, MI
Population 7,804
Waverly, MI
Population 23,575
East Lansing, MI
Population 45,758
Marshall Demographics And Statistics
Population over time in Marshall
The current population in Marshall is 6,804. The population has decreased 5.0% from 2010.
| Year | Population | % Change |
|---|---|---|
| 2024 | 6,804 | 0.1% |
| 2023 | 6,797 | -0.1% |
| 2022 | 6,806 | -0.4% |
| 2021 | 6,832 | -1.7% |
| 2020 | 6,947 | -0.7% |
| 2019 | 6,998 | -0.3% |
| 2018 | 7,021 | 0.1% |
| 2017 | 7,016 | -0.4% |
| 2016 | 7,046 | 0.1% |
| 2015 | 7,038 | -0.2% |
| 2014 | 7,054 | -0.3% |
| 2013 | 7,074 | -0.3% |
| 2012 | 7,094 | -0.5% |
| 2011 | 7,132 | -0.4% |
| 2010 | 7,160 | - |
Race / Ethnicity in Marshall
See the full breakdown
Marshall is:
86.7% White with 5,897 White residents.
0.6% African American with 42 African American residents.
0.1% American Indian with 9 American Indian residents.
1.2% Asian with 83 Asian residents.
0.0% Hawaiian with 0 Hawaiian residents.
0.0% Other with 0 Other residents.
6.4% Two Or More with 433 Two Or More residents.
5.0% Hispanic with 340 Hispanic residents.
| Race | Marshall | MI | USA |
|---|---|---|---|
| White | 86.7% | 72.4% | 57.4% |
| African American | 0.6% | 13.1% | 11.9% |
| American Indian | 0.1% | 0.3% | 0.5% |
| Asian | 1.2% | 3.4% | 5.9% |
| Hawaiian | 0.0% | 0.0% | 0.2% |
| Other | 0.0% | 0.5% | 0.6% |
| Two Or More | 6.4% | 4.5% | 4.3% |
| Hispanic | 5.0% | 5.9% | 19.3% |
Gender in Marshall
See the full breakdown
Marshall is 54.5% female with 3,706 female residents.
Marshall is 45.5% male with 3,097 male residents.
| Gender | Marshall | MI | USA |
|---|---|---|---|
| Female | 54.5% | 50.4% | 50.5% |
| Male | 45.5% | 49.6% | 49.5% |
Highest level of educational attainment in Marshall for adults over 25
See the full breakdown
1.0% of adults in Marshall completed < 9th grade.
2.0% of adults in Marshall completed 9-12th grade.
25.0% of adults in Marshall completed high school / ged.
18.0% of adults in Marshall completed some college.
12.0% of adults in Marshall completed associate's degree.
23.0% of adults in Marshall completed bachelor's degree.
14.0% of adults in Marshall completed master's degree.
2.0% of adults in Marshall completed professional degree.
3.0% of adults in Marshall completed doctorate degree.
| Education | Marshall | MI | USA |
|---|---|---|---|
| < 9th Grade | 1.0% | 3.0% | 4.0% |
| 9-12th Grade | 2.0% | 5.0% | 6.0% |
| High School / GED | 25.0% | 28.0% | 26.0% |
| Some College | 18.0% | 22.0% | 19.0% |
| Associate's Degree | 12.0% | 10.0% | 9.0% |
| Bachelor's Degree | 23.0% | 20.0% | 22.0% |
| Master's Degree | 14.0% | 9.0% | 10.0% |
| Professional Degree | 2.0% | 2.0% | 2.0% |
| Doctorate Degree | 3.0% | 1.0% | 2.0% |
Household Income For Marshall, Michigan
See the full breakdown
1.9% of households in Marshall earn Less than $10,000.
2.0% of households in Marshall earn $10,000 to $14,999.
7.0% of households in Marshall earn $15,000 to $24,999.
5.8% of households in Marshall earn $25,000 to $34,999.
17.0% of households in Marshall earn $35,000 to $49,999.
15.6% of households in Marshall earn $50,000 to $74,999.
20.1% of households in Marshall earn $75,000 to $99,999.
10.7% of households in Marshall earn $100,000 to $149,999.
12.4% of households in Marshall earn $150,000 to $199,999.
7.5% of households in Marshall earn $200,000 or more.
| Income | Marshall | MI | USA |
|---|---|---|---|
| Less than $10,000 | 1.9% | 5.2% | 5.0% |
| $10,000 to $14,999 | 2.0% | 3.8% | 3.4% |
| $15,000 to $24,999 | 7.0% | 6.8% | 6.3% |
| $25,000 to $34,999 | 5.8% | 7.3% | 6.6% |
| $35,000 to $49,999 | 17.0% | 11.4% | 10.1% |
| $50,000 to $74,999 | 15.6% | 16.8% | 15.5% |
| $75,000 to $99,999 | 20.1% | 13.2% | 12.6% |
| $100,000 to $149,999 | 10.7% | 17.3% | 17.5% |
| $150,000 to $199,999 | 12.4% | 8.6% | 9.6% |
| $200,000 or more | 7.5% | 9.5% | 13.4% |
Source: U.S. Census ACS 5-year estimates (2024)


