Mount Clemens SnackAbility
Overall SnackAbility
Cost of living in Mount Clemens summary. We use data on the cost of living to determine how expensive it is to live in Mount Clemens. Real estate prices drive most of the variance in cost of living around Michigan. Key points include:
The cost of living in Mount Clemens is 88 with 100 being average.
The cost of living in Mount Clemens is 0.9x lower than the national average.
The median home value in Mount Clemens is $175,694.
The median income in Mount Clemens is $52,310.
Mount Clemens's Overall Cost Of Living
Lower Than The National Average
Cost Of Living In Mount Clemens Comparison Table
| Living Expense | Mount Clemens | Michigan | National Average |
|---|---|---|---|
| Overall | 88 | 91 | 100 |
| Services | 96 | 97 | 100 |
| Groceries | 98 | 98 | 100 |
| Health | 72 | 75 | 100 |
| Housing | 98 | 98 | 100 |
| Transportation | 97 | 101 | 100 |
| Utilities | 94 | 98 | 100 |
Source: Cost of living index, normalized to US average = 100
Mount Clemens, MI Weather
The average high in Mount Clemens is 58.6° and the average low is 40.9°.
There are 67.9 days of precipitation each year.
Expect an average of 32.1 inches of precipitation each year with 31.7 inches of snow.
| Stat | Mount Clemens |
|---|---|
| Average Annual High | 58.6 |
| Average Annual Low | 40.9 |
| Annual Precipitation Days | 67.9 |
| Average Annual Precipitation | 32.1 |
| Average Annual Snowfall | 31.7 |
Average High
Days of Rain
Source: NOAA climate normals (30-year)
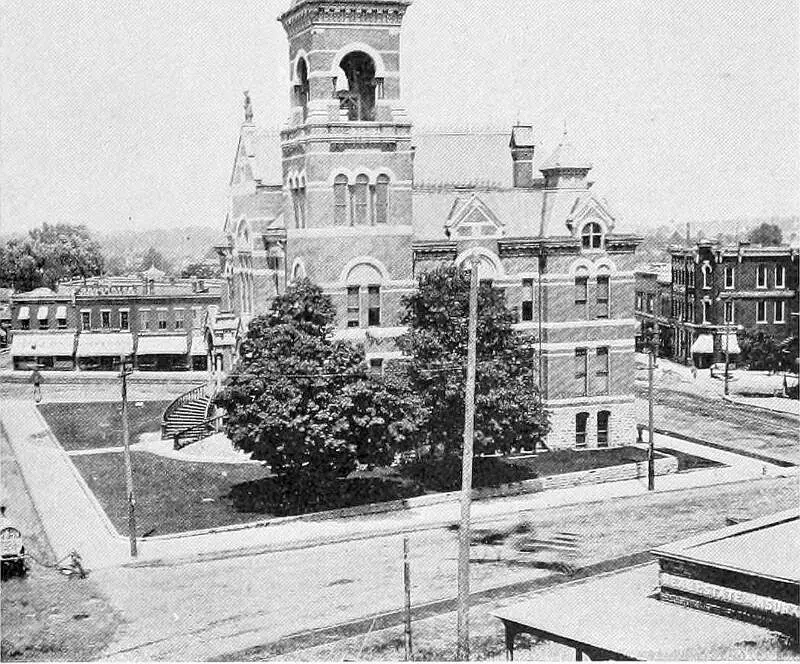
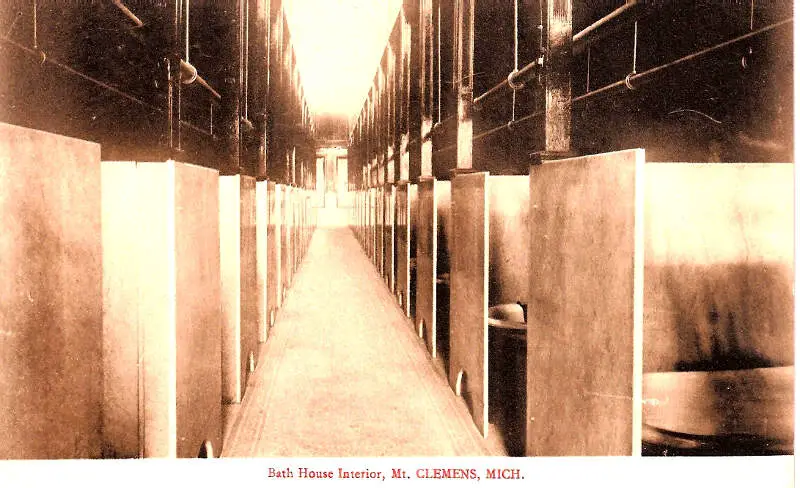
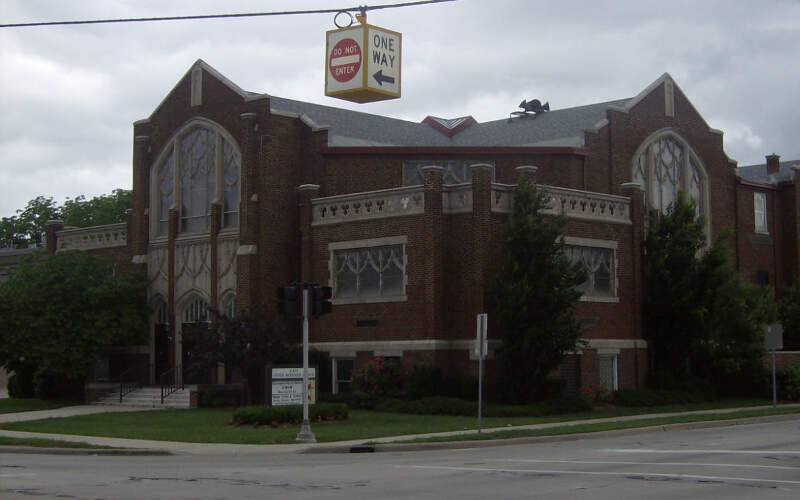
Mount Clemens, MI Photos
Rankings & Articles For Mount Clemens


Locations Around Mount Clemens
Map Of Mount Clemens, MI
Best Places Around Mount Clemens
Royal Oak, MI
Population 57,950
Birmingham, MI
Population 21,763
Berkley, MI
Population 15,149
Huntington Woods, MI
Population 6,328
Troy, MI
Population 87,898
Clawson, MI
Population 11,374
Rochester Hills, MI
Population 77,089
Grosse Pointe, MI
Population 5,541
Rochester, MI
Population 12,934
Grosse Pointe Park, MI
Population 11,319
Mount Clemens Demographics And Statistics
Population over time in Mount Clemens
The current population in Mount Clemens is 15,511. The population has decreased 6.7% from 2010.
| Year | Population | % Change |
|---|---|---|
| 2024 | 15,511 | -0.4% |
| 2023 | 15,567 | -0.7% |
| 2022 | 15,679 | -0.4% |
| 2021 | 15,735 | -2.9% |
| 2020 | 16,212 | -0.6% |
| 2019 | 16,315 | -0.3% |
| 2018 | 16,358 | -0.2% |
| 2017 | 16,383 | -0.0% |
| 2016 | 16,390 | 0.1% |
| 2015 | 16,381 | 0.2% |
| 2014 | 16,345 | -0.1% |
| 2013 | 16,362 | -0.2% |
| 2012 | 16,394 | -0.6% |
| 2011 | 16,485 | -0.8% |
| 2010 | 16,616 | - |
Race / Ethnicity in Mount Clemens
See the full breakdown
Mount Clemens is:
65.2% White with 10,118 White residents.
20.0% African American with 3,098 African American residents.
0.2% American Indian with 27 American Indian residents.
0.3% Asian with 46 Asian residents.
0.0% Hawaiian with 0 Hawaiian residents.
0.5% Other with 75 Other residents.
9.9% Two Or More with 1,531 Two Or More residents.
4.0% Hispanic with 616 Hispanic residents.
| Race | Mount Clemens | MI | USA |
|---|---|---|---|
| White | 65.2% | 72.4% | 57.4% |
| African American | 20.0% | 13.1% | 11.9% |
| American Indian | 0.2% | 0.3% | 0.5% |
| Asian | 0.3% | 3.4% | 5.9% |
| Hawaiian | 0.0% | 0.0% | 0.2% |
| Other | 0.5% | 0.5% | 0.6% |
| Two Or More | 9.9% | 4.5% | 4.3% |
| Hispanic | 4.0% | 5.9% | 19.3% |
Gender in Mount Clemens
See the full breakdown
Mount Clemens is 48.6% female with 7,536 female residents.
Mount Clemens is 51.4% male with 7,974 male residents.
| Gender | Mount Clemens | MI | USA |
|---|---|---|---|
| Female | 48.6% | 50.4% | 50.5% |
| Male | 51.4% | 49.6% | 49.5% |
Highest level of educational attainment in Mount Clemens for adults over 25
See the full breakdown
3.0% of adults in Mount Clemens completed < 9th grade.
8.0% of adults in Mount Clemens completed 9-12th grade.
34.0% of adults in Mount Clemens completed high school / ged.
24.0% of adults in Mount Clemens completed some college.
13.0% of adults in Mount Clemens completed associate's degree.
12.0% of adults in Mount Clemens completed bachelor's degree.
5.0% of adults in Mount Clemens completed master's degree.
1.0% of adults in Mount Clemens completed professional degree.
0.0% of adults in Mount Clemens completed doctorate degree.
| Education | Mount Clemens | MI | USA |
|---|---|---|---|
| < 9th Grade | 3.0% | 3.0% | 4.0% |
| 9-12th Grade | 8.0% | 5.0% | 6.0% |
| High School / GED | 34.0% | 28.0% | 26.0% |
| Some College | 24.0% | 22.0% | 19.0% |
| Associate's Degree | 13.0% | 10.0% | 9.0% |
| Bachelor's Degree | 12.0% | 20.0% | 22.0% |
| Master's Degree | 5.0% | 9.0% | 10.0% |
| Professional Degree | 1.0% | 2.0% | 2.0% |
| Doctorate Degree | 0.0% | 1.0% | 2.0% |
Household Income For Mount Clemens, Michigan
See the full breakdown
4.9% of households in Mount Clemens earn Less than $10,000.
9.7% of households in Mount Clemens earn $10,000 to $14,999.
8.9% of households in Mount Clemens earn $15,000 to $24,999.
7.9% of households in Mount Clemens earn $25,000 to $34,999.
16.5% of households in Mount Clemens earn $35,000 to $49,999.
11.0% of households in Mount Clemens earn $50,000 to $74,999.
14.2% of households in Mount Clemens earn $75,000 to $99,999.
14.3% of households in Mount Clemens earn $100,000 to $149,999.
6.5% of households in Mount Clemens earn $150,000 to $199,999.
6.1% of households in Mount Clemens earn $200,000 or more.
| Income | Mount Clemens | MI | USA |
|---|---|---|---|
| Less than $10,000 | 4.9% | 5.2% | 5.0% |
| $10,000 to $14,999 | 9.7% | 3.8% | 3.4% |
| $15,000 to $24,999 | 8.9% | 6.8% | 6.3% |
| $25,000 to $34,999 | 7.9% | 7.3% | 6.6% |
| $35,000 to $49,999 | 16.5% | 11.4% | 10.1% |
| $50,000 to $74,999 | 11.0% | 16.8% | 15.5% |
| $75,000 to $99,999 | 14.2% | 13.2% | 12.6% |
| $100,000 to $149,999 | 14.3% | 17.3% | 17.5% |
| $150,000 to $199,999 | 6.5% | 8.6% | 9.6% |
| $200,000 or more | 6.1% | 9.5% | 13.4% |
Source: U.S. Census ACS 5-year estimates (2024)


