St. Joseph SnackAbility
Overall SnackAbility
Crime in St. Joseph summary. We use data from the FBI to determine the crime rates in St. Joseph. Key points include:
There were 152 total crimes in St. Joseph in the last reporting year.
The overall crime rate per 100,000 people in St. Joseph is 1,976.9 / 100k people.
The violent crime rate per 100,000 people in St. Joseph is 442.2 / 100k people.
The property crime rate per 100,000 people in St. Joseph is 1,534.7 / 100k people.
Overall, crime in St. Joseph is -6.72% below the national average.
Total Crimes
Below National Average
Crime In St. Joseph Comparison Table
| Statistic | Count Raw |
St. Joseph / 100k People |
Michigan / 100k People |
National / 100k People |
|---|---|---|---|---|
| Total Crimes Per 100K | 152 | 1,976.9 | 1,813.2 | 2,119.2 |
| Violent Crime | 34 | 442.2 | 434.3 | 359.0 |
| Murder | 0 | 0.0 | 5.2 | 5.0 |
| Robbery | 1 | 13.0 | 31.3 | 61.0 |
| Aggravated Assault | 31 | 403.2 | 341.3 | 256.0 |
| Property Crime | 118 | 1,534.7 | 1,378.9 | 1,760.0 |
| Burglary | 9 | 117.1 | 184.2 | 229.0 |
| Larceny | 104 | 1,352.6 | 963.6 | 1,272.0 |
| Car Theft | 5 | 65.0 | 231.0 | 259.0 |
Source: FBI Uniform Crime Reporting (2024)
Cost of living in St. Joseph summary. We use data on the cost of living to determine how expensive it is to live in St. Joseph. Real estate prices drive most of the variance in cost of living around Michigan. Key points include:
The cost of living in St. Joseph is 98 with 100 being average.
The cost of living in St. Joseph is 1.0x lower than the national average.
The median home value in St. Joseph is $328,306.
The median income in St. Joseph is $84,057.
St. Joseph's Overall Cost Of Living
Lower Than The National Average
Cost Of Living In St. Joseph Comparison Table
| Living Expense | St. Joseph | Michigan | National Average |
|---|---|---|---|
| Overall | 98 | 91 | 100 |
| Services | 93 | 97 | 100 |
| Groceries | 98 | 98 | 100 |
| Health | 104 | 75 | 100 |
| Housing | 94 | 98 | 100 |
| Transportation | 97 | 101 | 100 |
| Utilities | 96 | 98 | 100 |
Source: Cost of living index, normalized to US average = 100
St. Joseph, MI Weather
The average high in St. Joseph is 58.0° and the average low is 40.6°.
There are 77.3 days of precipitation each year.
Expect an average of 36.6 inches of precipitation each year with 80.6 inches of snow.
| Stat | St. Joseph |
|---|---|
| Average Annual High | 58.0 |
| Average Annual Low | 40.6 |
| Annual Precipitation Days | 77.3 |
| Average Annual Precipitation | 36.6 |
| Average Annual Snowfall | 80.6 |
Average High
Days of Rain
Source: NOAA climate normals (30-year)
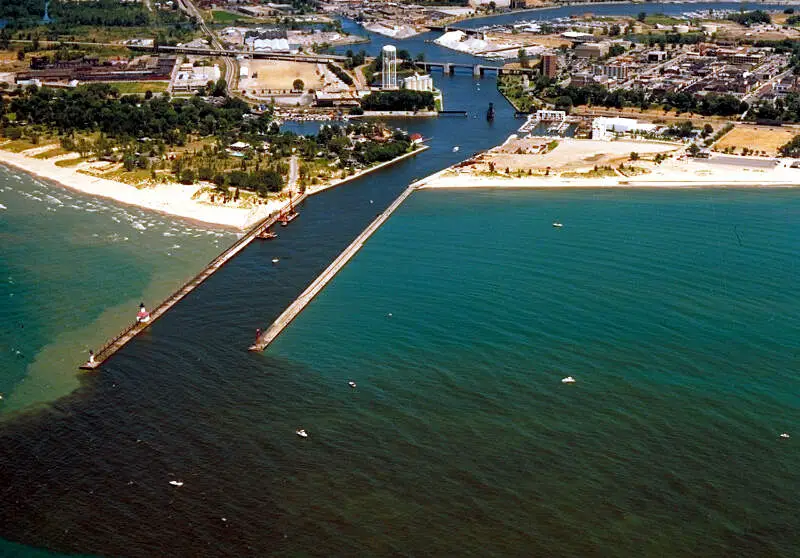
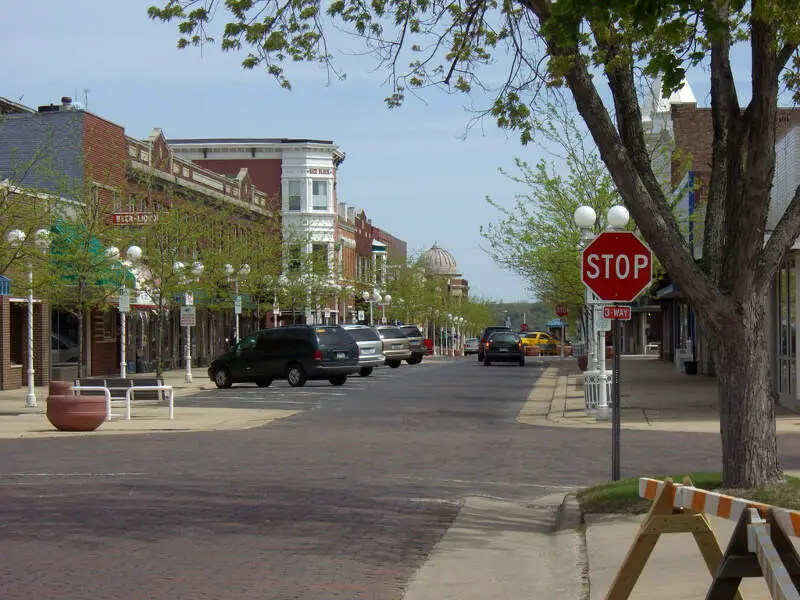
St. Joseph, MI Photos
Rankings & Articles For St. Joseph


Locations Around St. Joseph
Map Of St. Joseph, MI
Best Places Around St. Joseph
Portage, MI
Population 49,259
Westwood, MI
Population 8,867
Dunlap, IN
Population 6,109
Granger, IN
Population 30,321
Westville, IN
Population 5,279
Goshen, IN
Population 34,420
Chesterton, IN
Population 14,446
Fair Plain, MI
Population 7,330
Allegan, MI
Population 5,172
Kalamazoo, MI
Population 73,076
St. Joseph Demographics And Statistics
Population over time in St. Joseph
The current population in St. Joseph is 7,986. The population has decreased 4.9% from 2010.
| Year | Population | % Change |
|---|---|---|
| 2024 | 7,986 | 2.3% |
| 2023 | 7,805 | -0.6% |
| 2022 | 7,852 | -0.2% |
| 2021 | 7,868 | -5.5% |
| 2020 | 8,328 | 0.1% |
| 2019 | 8,316 | 0.0% |
| 2018 | 8,314 | 0.2% |
| 2017 | 8,301 | -0.1% |
| 2016 | 8,307 | -0.0% |
| 2015 | 8,311 | 0.0% |
| 2014 | 8,310 | -0.4% |
| 2013 | 8,342 | -0.2% |
| 2012 | 8,358 | -0.4% |
| 2011 | 8,395 | 0.0% |
| 2010 | 8,394 | - |
Race / Ethnicity in St. Joseph
See the full breakdown
St. Joseph is:
83.7% White with 6,682 White residents.
4.5% African American with 356 African American residents.
0.2% American Indian with 14 American Indian residents.
1.7% Asian with 137 Asian residents.
0.0% Hawaiian with 0 Hawaiian residents.
0.4% Other with 29 Other residents.
4.4% Two Or More with 353 Two Or More residents.
5.2% Hispanic with 415 Hispanic residents.
| Race | St. Joseph | MI | USA |
|---|---|---|---|
| White | 83.7% | 72.4% | 57.4% |
| African American | 4.5% | 13.1% | 11.9% |
| American Indian | 0.2% | 0.3% | 0.5% |
| Asian | 1.7% | 3.4% | 5.9% |
| Hawaiian | 0.0% | 0.0% | 0.2% |
| Other | 0.4% | 0.5% | 0.6% |
| Two Or More | 4.4% | 4.5% | 4.3% |
| Hispanic | 5.2% | 5.9% | 19.3% |
Gender in St. Joseph
See the full breakdown
St. Joseph is 50.3% female with 4,020 female residents.
St. Joseph is 49.7% male with 3,965 male residents.
| Gender | St. Joseph | MI | USA |
|---|---|---|---|
| Female | 50.3% | 50.4% | 50.5% |
| Male | 49.7% | 49.6% | 49.5% |
Highest level of educational attainment in St. Joseph for adults over 25
See the full breakdown
-0.0% of adults in St. Joseph completed < 9th grade.
2.0% of adults in St. Joseph completed 9-12th grade.
18.0% of adults in St. Joseph completed high school / ged.
17.0% of adults in St. Joseph completed some college.
7.0% of adults in St. Joseph completed associate's degree.
34.0% of adults in St. Joseph completed bachelor's degree.
18.0% of adults in St. Joseph completed master's degree.
3.0% of adults in St. Joseph completed professional degree.
1.0% of adults in St. Joseph completed doctorate degree.
| Education | St. Joseph | MI | USA |
|---|---|---|---|
| < 9th Grade | -0.0% | 3.0% | 4.0% |
| 9-12th Grade | 2.0% | 5.0% | 6.0% |
| High School / GED | 18.0% | 28.0% | 26.0% |
| Some College | 17.0% | 22.0% | 19.0% |
| Associate's Degree | 7.0% | 10.0% | 9.0% |
| Bachelor's Degree | 34.0% | 20.0% | 22.0% |
| Master's Degree | 18.0% | 9.0% | 10.0% |
| Professional Degree | 3.0% | 2.0% | 2.0% |
| Doctorate Degree | 1.0% | 1.0% | 2.0% |
Household Income For St. Joseph, Michigan
See the full breakdown
4.5% of households in St. Joseph earn Less than $10,000.
4.8% of households in St. Joseph earn $10,000 to $14,999.
5.0% of households in St. Joseph earn $15,000 to $24,999.
5.9% of households in St. Joseph earn $25,000 to $34,999.
9.3% of households in St. Joseph earn $35,000 to $49,999.
16.8% of households in St. Joseph earn $50,000 to $74,999.
11.4% of households in St. Joseph earn $75,000 to $99,999.
18.3% of households in St. Joseph earn $100,000 to $149,999.
11.9% of households in St. Joseph earn $150,000 to $199,999.
12.1% of households in St. Joseph earn $200,000 or more.
| Income | St. Joseph | MI | USA |
|---|---|---|---|
| Less than $10,000 | 4.5% | 5.2% | 5.0% |
| $10,000 to $14,999 | 4.8% | 3.8% | 3.4% |
| $15,000 to $24,999 | 5.0% | 6.8% | 6.3% |
| $25,000 to $34,999 | 5.9% | 7.3% | 6.6% |
| $35,000 to $49,999 | 9.3% | 11.4% | 10.1% |
| $50,000 to $74,999 | 16.8% | 16.8% | 15.5% |
| $75,000 to $99,999 | 11.4% | 13.2% | 12.6% |
| $100,000 to $149,999 | 18.3% | 17.3% | 17.5% |
| $150,000 to $199,999 | 11.9% | 8.6% | 9.6% |
| $200,000 or more | 12.1% | 9.5% | 13.4% |
Source: U.S. Census ACS 5-year estimates (2024)


