Taylor SnackAbility
Overall SnackAbility
Crime in Taylor summary. We use data from the FBI to determine the crime rates in Taylor. Key points include:
There were 1,730 total crimes in Taylor in the last reporting year.
The overall crime rate per 100,000 people in Taylor is 2,854.7 / 100k people.
The violent crime rate per 100,000 people in Taylor is 838.3 / 100k people.
The property crime rate per 100,000 people in Taylor is 2,016.4 / 100k people.
Overall, crime in Taylor is 34.70% above the national average.
Total Crimes
Above National Average
Crime In Taylor Comparison Table
| Statistic | Count Raw |
Taylor / 100k People |
Michigan / 100k People |
National / 100k People |
|---|---|---|---|---|
| Total Crimes Per 100K | 1,730 | 2,854.7 | 1,813.2 | 2,119.2 |
| Violent Crime | 508 | 838.3 | 434.3 | 359.0 |
| Murder | 3 | 5.0 | 5.2 | 5.0 |
| Robbery | 46 | 75.9 | 31.3 | 61.0 |
| Aggravated Assault | 429 | 707.9 | 341.3 | 256.0 |
| Property Crime | 1,222 | 2,016.4 | 1,378.9 | 1,760.0 |
| Burglary | 180 | 297.0 | 184.2 | 229.0 |
| Larceny | 831 | 1,371.2 | 963.6 | 1,272.0 |
| Car Theft | 211 | 348.2 | 231.0 | 259.0 |
Source: FBI Uniform Crime Reporting (2024)
Cost of living in Taylor summary. We use data on the cost of living to determine how expensive it is to live in Taylor. Real estate prices drive most of the variance in cost of living around Michigan. Key points include:
The cost of living in Taylor is 88 with 100 being average.
The cost of living in Taylor is 0.9x lower than the national average.
The median home value in Taylor is $175,806.
The median income in Taylor is $61,081.
Taylor's Overall Cost Of Living
Lower Than The National Average
Cost Of Living In Taylor Comparison Table
| Living Expense | Taylor | Michigan | National Average |
|---|---|---|---|
| Overall | 88 | 91 | 100 |
| Services | 94 | 97 | 100 |
| Groceries | 99 | 98 | 100 |
| Health | 70 | 75 | 100 |
| Housing | 102 | 98 | 100 |
| Transportation | 102 | 101 | 100 |
| Utilities | 98 | 98 | 100 |
Source: Cost of living index, normalized to US average = 100
Taylor, MI Weather
The average high in Taylor is 58.8° and the average low is 40.9°.
There are 73.3 days of precipitation each year.
Expect an average of 33.5 inches of precipitation each year with 37.9 inches of snow.
| Stat | Taylor |
|---|---|
| Average Annual High | 58.8 |
| Average Annual Low | 40.9 |
| Annual Precipitation Days | 73.3 |
| Average Annual Precipitation | 33.5 |
| Average Annual Snowfall | 37.9 |
Average High
Days of Rain
Source: NOAA climate normals (30-year)
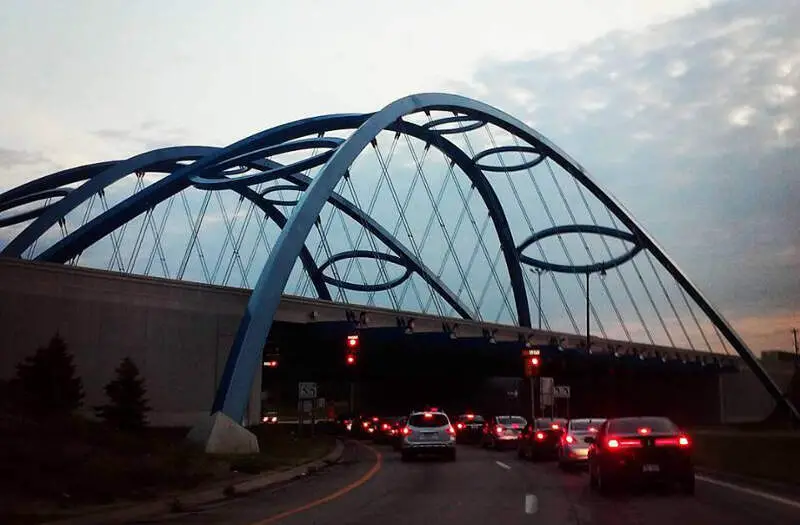
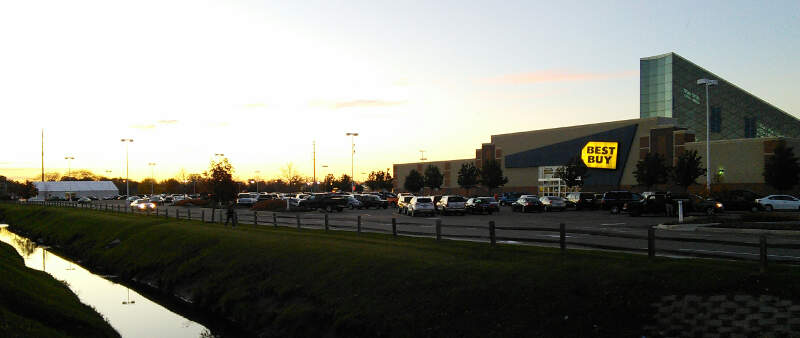
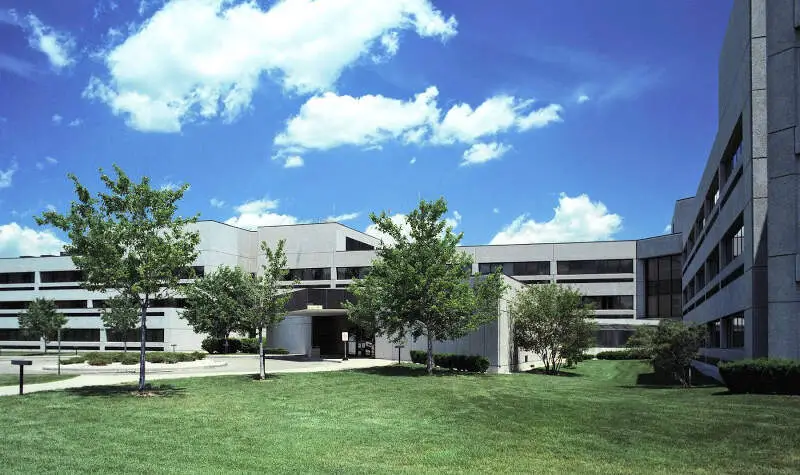
Taylor, MI Photos


Rankings & Articles For Taylor


Locations Around Taylor
Map Of Taylor, MI
Best Places Around Taylor
Plymouth, MI
Population 9,214
Berkley, MI
Population 15,149
Northville, MI
Population 6,069
Huntington Woods, MI
Population 6,328
Livonia, MI
Population 93,851
Farmington, MI
Population 11,504
Farmington Hills, MI
Population 83,515
Allen Park, MI
Population 27,925
Wyandotte, MI
Population 24,489
Dearborn, MI
Population 107,423
Taylor Demographics And Statistics
Population over time in Taylor
The current population in Taylor is 62,081. The population has decreased 2.7% from 2010.
| Year | Population | % Change |
|---|---|---|
| 2024 | 62,081 | -0.5% |
| 2023 | 62,405 | -0.8% |
| 2022 | 62,937 | -0.2% |
| 2021 | 63,071 | 3.1% |
| 2020 | 61,164 | -0.4% |
| 2019 | 61,379 | -0.3% |
| 2018 | 61,574 | -0.1% |
| 2017 | 61,648 | -0.1% |
| 2016 | 61,716 | -0.5% |
| 2015 | 62,021 | -0.5% |
| 2014 | 62,331 | -0.4% |
| 2013 | 62,592 | -0.5% |
| 2012 | 62,916 | -0.7% |
| 2011 | 63,332 | -0.8% |
| 2010 | 63,833 | - |
Race / Ethnicity in Taylor
See the full breakdown
Taylor is:
65.7% White with 40,818 White residents.
18.9% African American with 11,720 African American residents.
0.1% American Indian with 65 American Indian residents.
2.2% Asian with 1,335 Asian residents.
0.0% Hawaiian with 0 Hawaiian residents.
0.3% Other with 175 Other residents.
5.2% Two Or More with 3,234 Two Or More residents.
7.6% Hispanic with 4,734 Hispanic residents.
| Race | Taylor | MI | USA |
|---|---|---|---|
| White | 65.7% | 72.4% | 57.4% |
| African American | 18.9% | 13.1% | 11.9% |
| American Indian | 0.1% | 0.3% | 0.5% |
| Asian | 2.2% | 3.4% | 5.9% |
| Hawaiian | 0.0% | 0.0% | 0.2% |
| Other | 0.3% | 0.5% | 0.6% |
| Two Or More | 5.2% | 4.5% | 4.3% |
| Hispanic | 7.6% | 5.9% | 19.3% |
Gender in Taylor
See the full breakdown
Taylor is 50.7% female with 31,496 female residents.
Taylor is 49.3% male with 30,585 male residents.
| Gender | Taylor | MI | USA |
|---|---|---|---|
| Female | 50.7% | 50.4% | 50.5% |
| Male | 49.3% | 49.6% | 49.5% |
Highest level of educational attainment in Taylor for adults over 25
See the full breakdown
4.0% of adults in Taylor completed < 9th grade.
10.0% of adults in Taylor completed 9-12th grade.
39.0% of adults in Taylor completed high school / ged.
23.0% of adults in Taylor completed some college.
8.0% of adults in Taylor completed associate's degree.
12.0% of adults in Taylor completed bachelor's degree.
4.0% of adults in Taylor completed master's degree.
0.0% of adults in Taylor completed professional degree.
0.0% of adults in Taylor completed doctorate degree.
| Education | Taylor | MI | USA |
|---|---|---|---|
| < 9th Grade | 4.0% | 3.0% | 4.0% |
| 9-12th Grade | 10.0% | 5.0% | 6.0% |
| High School / GED | 39.0% | 28.0% | 26.0% |
| Some College | 23.0% | 22.0% | 19.0% |
| Associate's Degree | 8.0% | 10.0% | 9.0% |
| Bachelor's Degree | 12.0% | 20.0% | 22.0% |
| Master's Degree | 4.0% | 9.0% | 10.0% |
| Professional Degree | 0.0% | 2.0% | 2.0% |
| Doctorate Degree | 0.0% | 1.0% | 2.0% |
Household Income For Taylor, Michigan
See the full breakdown
6.5% of households in Taylor earn Less than $10,000.
4.3% of households in Taylor earn $10,000 to $14,999.
7.9% of households in Taylor earn $15,000 to $24,999.
8.6% of households in Taylor earn $25,000 to $34,999.
13.5% of households in Taylor earn $35,000 to $49,999.
20.5% of households in Taylor earn $50,000 to $74,999.
12.5% of households in Taylor earn $75,000 to $99,999.
16.5% of households in Taylor earn $100,000 to $149,999.
5.6% of households in Taylor earn $150,000 to $199,999.
4.0% of households in Taylor earn $200,000 or more.
| Income | Taylor | MI | USA |
|---|---|---|---|
| Less than $10,000 | 6.5% | 5.2% | 5.0% |
| $10,000 to $14,999 | 4.3% | 3.8% | 3.4% |
| $15,000 to $24,999 | 7.9% | 6.8% | 6.3% |
| $25,000 to $34,999 | 8.6% | 7.3% | 6.6% |
| $35,000 to $49,999 | 13.5% | 11.4% | 10.1% |
| $50,000 to $74,999 | 20.5% | 16.8% | 15.5% |
| $75,000 to $99,999 | 12.5% | 13.2% | 12.6% |
| $100,000 to $149,999 | 16.5% | 17.3% | 17.5% |
| $150,000 to $199,999 | 5.6% | 8.6% | 9.6% |
| $200,000 or more | 4.0% | 9.5% | 13.4% |
Source: U.S. Census ACS 5-year estimates (2024)


