Anoka SnackAbility
Overall SnackAbility
Crime in Anoka summary. We use data from the FBI to determine the crime rates in Anoka. Key points include:
There were 281 total crimes in Anoka in the last reporting year.
The overall crime rate per 100,000 people in Anoka is 1,558.6 / 100k people.
The violent crime rate per 100,000 people in Anoka is 288.4 / 100k people.
The property crime rate per 100,000 people in Anoka is 1,270.2 / 100k people.
Overall, crime in Anoka is -26.45% below the national average.
Total Crimes
Below National Average
Crime In Anoka Comparison Table
| Statistic | Count Raw |
Anoka / 100k People |
Minnesota / 100k People |
National / 100k People |
|---|---|---|---|---|
| Total Crimes Per 100K | 281 | 1,558.6 | 1,862.9 | 2,119.2 |
| Violent Crime | 52 | 288.4 | 256.6 | 359.0 |
| Murder | 0 | 0.0 | 2.9 | 5.0 |
| Robbery | 4 | 22.2 | 48.9 | 61.0 |
| Aggravated Assault | 39 | 216.3 | 168.0 | 256.0 |
| Property Crime | 229 | 1,270.2 | 1,606.3 | 1,760.0 |
| Burglary | 25 | 138.7 | 184.7 | 229.0 |
| Larceny | 182 | 1,009.5 | 1,208.5 | 1,272.0 |
| Car Theft | 22 | 122.0 | 213.1 | 259.0 |
Source: FBI Uniform Crime Reporting (2024)
Cost of living in Anoka summary. We use data on the cost of living to determine how expensive it is to live in Anoka. Real estate prices drive most of the variance in cost of living around Minnesota. Key points include:
The cost of living in Anoka is 103 with 100 being average.
The cost of living in Anoka is 1.0x higher than the national average.
The median home value in Anoka is $326,596.
The median income in Anoka is $75,948.
Anoka's Overall Cost Of Living
Higher Than The National Average
Cost Of Living In Anoka Comparison Table
| Living Expense | Anoka | Minnesota | National Average |
|---|---|---|---|
| Overall | 103 | 101 | 100 |
| Services | 102 | 101 | 100 |
| Groceries | 102 | 99 | 100 |
| Health | 114 | 99 | 100 |
| Housing | 98 | 101 | 100 |
| Transportation | 103 | 103 | 100 |
| Utilities | 96 | 101 | 100 |
Source: Cost of living index, normalized to US average = 100
Anoka, MN Weather
The average high in Anoka is 54.9° and the average low is 35.2°.
There are 65.2 days of precipitation each year.
Expect an average of 32.2 inches of precipitation each year with 54.1 inches of snow.
| Stat | Anoka |
|---|---|
| Average Annual High | 54.9 |
| Average Annual Low | 35.2 |
| Annual Precipitation Days | 65.2 |
| Average Annual Precipitation | 32.2 |
| Average Annual Snowfall | 54.1 |
Average High
Days of Rain
Source: NOAA climate normals (30-year)
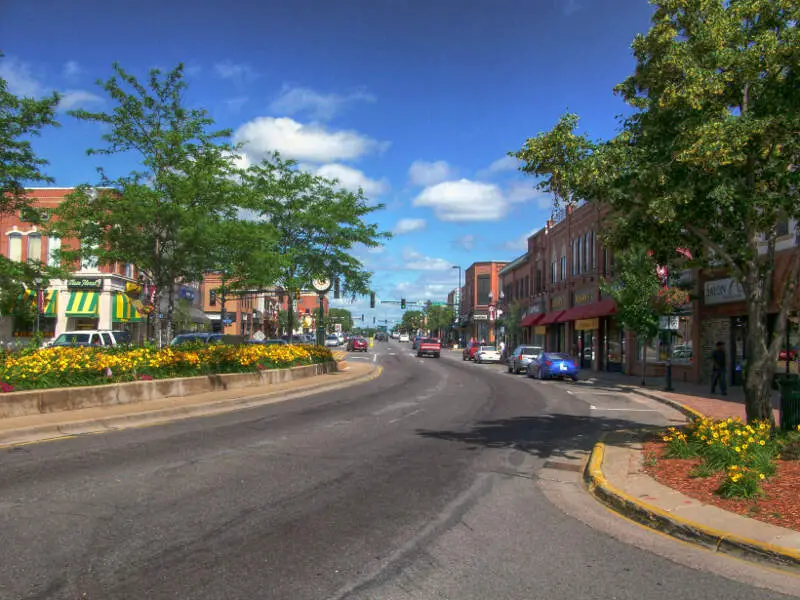
Anoka, MN Photos

Rankings & Articles For Anoka


Locations Around Anoka
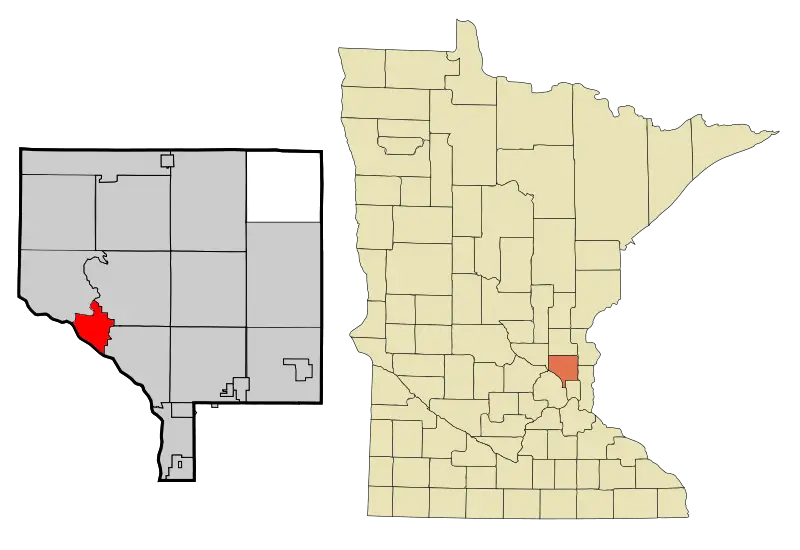
Map Of Anoka, MN
Best Places Around Anoka
Maple Grove, MN
Population 71,173
Shoreview, MN
Population 26,714
Plymouth, MN
Population 79,220
Rogers, MN
Population 13,685
Champlin, MN
Population 23,294
Golden Valley, MN
Population 21,725
Corcoran, MN
Population 7,302
Arden Hills, MN
Population 9,658
St. Louis Park, MN
Population 49,594
Andover, MN
Population 33,035
Anoka Demographics And Statistics
Population over time in Anoka
The current population in Anoka is 17,970. The population has increased 3.0% from 2010.
| Year | Population | % Change |
|---|---|---|
| 2024 | 17,970 | 0.2% |
| 2023 | 17,941 | 0.3% |
| 2022 | 17,892 | 0.8% |
| 2021 | 17,749 | 1.4% |
| 2020 | 17,512 | 0.2% |
| 2019 | 17,471 | 0.3% |
| 2018 | 17,419 | 0.3% |
| 2017 | 17,374 | 0.3% |
| 2016 | 17,325 | 0.5% |
| 2015 | 17,244 | 0.2% |
| 2014 | 17,202 | -0.1% |
| 2013 | 17,218 | -0.2% |
| 2012 | 17,250 | -0.6% |
| 2011 | 17,357 | -0.5% |
| 2010 | 17,449 | - |
Race / Ethnicity in Anoka
See the full breakdown
Anoka is:
74.9% White with 13,468 White residents.
7.9% African American with 1,420 African American residents.
0.8% American Indian with 145 American Indian residents.
3.7% Asian with 665 Asian residents.
0.0% Hawaiian with 0 Hawaiian residents.
0.4% Other with 67 Other residents.
4.4% Two Or More with 786 Two Or More residents.
7.9% Hispanic with 1,419 Hispanic residents.
| Race | Anoka | MN | USA |
|---|---|---|---|
| White | 74.9% | 75.9% | 57.4% |
| African American | 7.9% | 6.9% | 11.9% |
| American Indian | 0.8% | 0.7% | 0.5% |
| Asian | 3.7% | 5.1% | 5.9% |
| Hawaiian | 0.0% | 0.0% | 0.2% |
| Other | 0.4% | 0.5% | 0.6% |
| Two Or More | 4.4% | 4.5% | 4.3% |
| Hispanic | 7.9% | 6.4% | 19.3% |
Gender in Anoka
See the full breakdown
Anoka is 50.3% female with 9,034 female residents.
Anoka is 49.7% male with 8,936 male residents.
| Gender | Anoka | MN | USA |
|---|---|---|---|
| Female | 50.3% | 49.9% | 50.5% |
| Male | 49.7% | 50.1% | 49.5% |
Highest level of educational attainment in Anoka for adults over 25
See the full breakdown
3.0% of adults in Anoka completed < 9th grade.
4.0% of adults in Anoka completed 9-12th grade.
30.0% of adults in Anoka completed high school / ged.
23.0% of adults in Anoka completed some college.
14.0% of adults in Anoka completed associate's degree.
18.0% of adults in Anoka completed bachelor's degree.
7.0% of adults in Anoka completed master's degree.
0.0% of adults in Anoka completed professional degree.
1.0% of adults in Anoka completed doctorate degree.
| Education | Anoka | MN | USA |
|---|---|---|---|
| < 9th Grade | 3.0% | 3.0% | 4.0% |
| 9-12th Grade | 4.0% | 3.0% | 6.0% |
| High School / GED | 30.0% | 23.0% | 26.0% |
| Some College | 23.0% | 19.0% | 19.0% |
| Associate's Degree | 14.0% | 12.0% | 9.0% |
| Bachelor's Degree | 18.0% | 26.0% | 22.0% |
| Master's Degree | 7.0% | 10.0% | 10.0% |
| Professional Degree | 0.0% | 2.0% | 2.0% |
| Doctorate Degree | 1.0% | 2.0% | 2.0% |
Household Income For Anoka, Minnesota
See the full breakdown
3.3% of households in Anoka earn Less than $10,000.
3.2% of households in Anoka earn $10,000 to $14,999.
4.8% of households in Anoka earn $15,000 to $24,999.
6.2% of households in Anoka earn $25,000 to $34,999.
12.6% of households in Anoka earn $35,000 to $49,999.
19.6% of households in Anoka earn $50,000 to $74,999.
12.9% of households in Anoka earn $75,000 to $99,999.
21.4% of households in Anoka earn $100,000 to $149,999.
10.9% of households in Anoka earn $150,000 to $199,999.
5.1% of households in Anoka earn $200,000 or more.
| Income | Anoka | MN | USA |
|---|---|---|---|
| Less than $10,000 | 3.3% | 3.8% | 5.0% |
| $10,000 to $14,999 | 3.2% | 2.7% | 3.4% |
| $15,000 to $24,999 | 4.8% | 5.2% | 6.3% |
| $25,000 to $34,999 | 6.2% | 5.6% | 6.6% |
| $35,000 to $49,999 | 12.6% | 9.3% | 10.1% |
| $50,000 to $74,999 | 19.6% | 15.6% | 15.5% |
| $75,000 to $99,999 | 12.9% | 13.2% | 12.6% |
| $100,000 to $149,999 | 21.4% | 19.6% | 17.5% |
| $150,000 to $199,999 | 10.9% | 11.2% | 9.6% |
| $200,000 or more | 5.1% | 13.8% | 13.4% |
Source: U.S. Census ACS 5-year estimates (2024)


