

Water is the world’s 3rd leading cause of injury or death, and Minnesota is The Land of 10,000 Lakes. But, there is something more dangerous than lakes in this Midwest State.
Minnesota has super dangerous cities.
We used Saturday Night Science to compare the FBI’s latest crime report for violent crime and property crime statistics for 128 cities with over 5,000 residents in Minnesota. While Minnesota might not be one of the top ten most dangerous states in the country, the state’s most dangerous places do need some work.
So grab a Juicy Lucy and look at the list below before making any life-changing decisions.
Not sold on Minnesota? Take the two-minute Find Your Place quiz and see which state actually fits you.
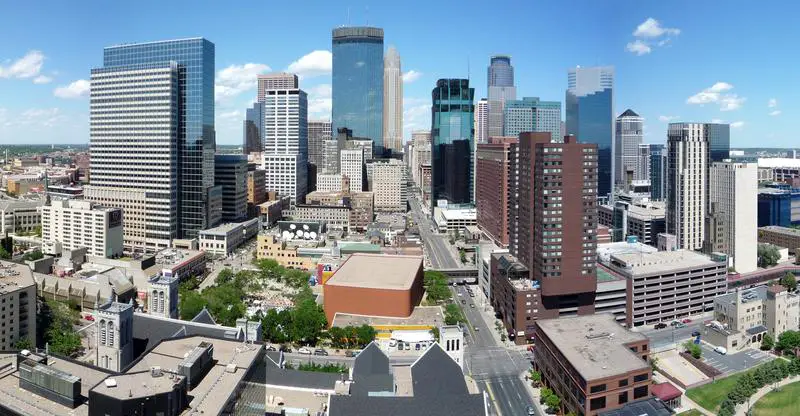
1,132 violent crimes /100k · 5,253 property crimes /100k · #1 most violent in Minnesota
 Located in
Hennepin County, Minnesota
Located in
Hennepin County, Minnesota
When it comes to the Twin Cities, Minneapolis comes in as the naughtier sibling. Take our advice and buddy up in the City of Lakes, because, with an average of almost one murder a week, Minneapolis has the highest murder rate in Minnesota.
On top of that, Minneapolis had the eighth highest rate of rape cases in the state. Overall, residents had a 1 in 88 shot of being the victim of a violent crime.
Even your home is unsafe in Minneapolis, considering the city had the highest burglary rate statewide.
Still, if you stick to one of Minneapolis’s safest neighborhoods and use good judgment, you shouldn’t have to worry.
Data | Crime | Cost of living | Movers | Compare
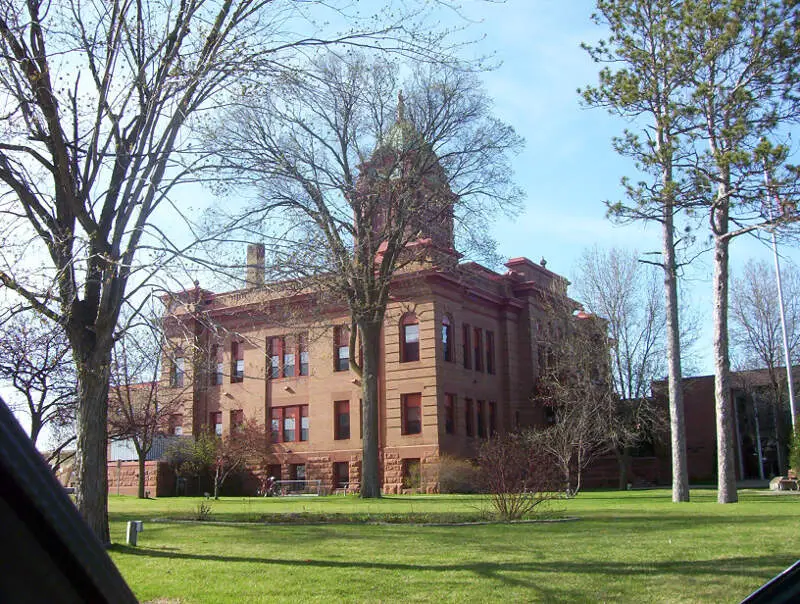
481 violent crimes /100k · 6,134 property crimes /100k · #6 most violent in Minnesota
 Located in
Beltrami County, Minnesota
Located in
Beltrami County, Minnesota
The home of Paul Bunyan and Babe the Blue Ox, Bemidji gained some fame for being the location of Netflix’s Fargo.
It turns out, the crime dramedy actually let Bemidji off easy when it comes to crime rates, seeing as the real city ranks as the second most dangerous in Minnesota. Folks in Bemidji had a 1 in 16 chance of being the victim of a property crime over 2024, so watch your wallet, or you’ll be saying “oh, jeez” before you know it.
On top of that, Bemidji had the sixth highest violent crime rate in Minnesota, with an aggravated assault going down more than once a week, on average.
Data | Crime | Cost of living | Movers
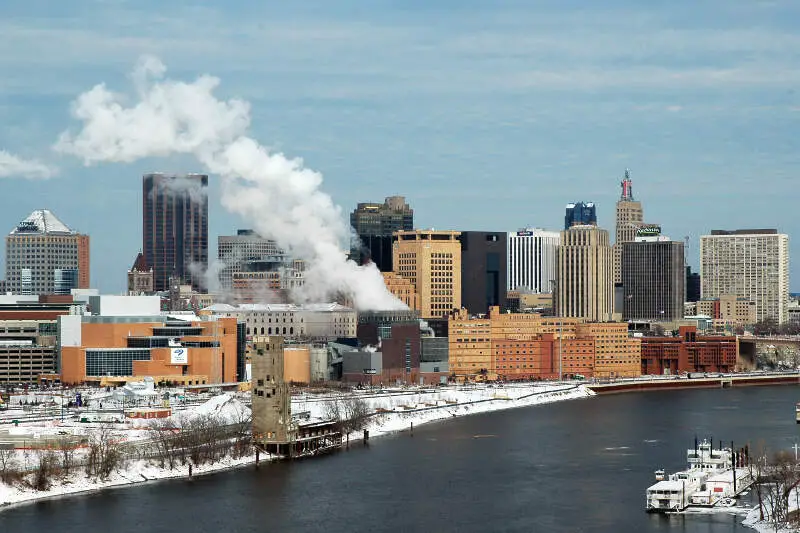
624 violent crimes /100k · 3,090 property crimes /100k · #3 most violent in Minnesota
 Located in
Ramsey County, Minnesota
Located in
Ramsey County, Minnesota
Like its Twin City, St. Paul is a victim of simply being a big city. Hey, when you have loads of fun neighborhoods and great things to do, more people are going to wander through and inflate your crime numbers.
Still, Minnesota’s capital city has come crime numbers that are hard to ignore. Like residents having a 1 in 160 chance of being the victim of a violent crime over a year. Or about two murders a month going down, which works out to the ninth highest murder rate in Minnesota.
And while property crime isn’t too bad in St. Paul, it still has higher rates of car theft and arson than Minneapolis, with 2,081 stolen cars and 178 arson cases recorded in 2024.
Data | Crime | Cost of living | Movers | Compare
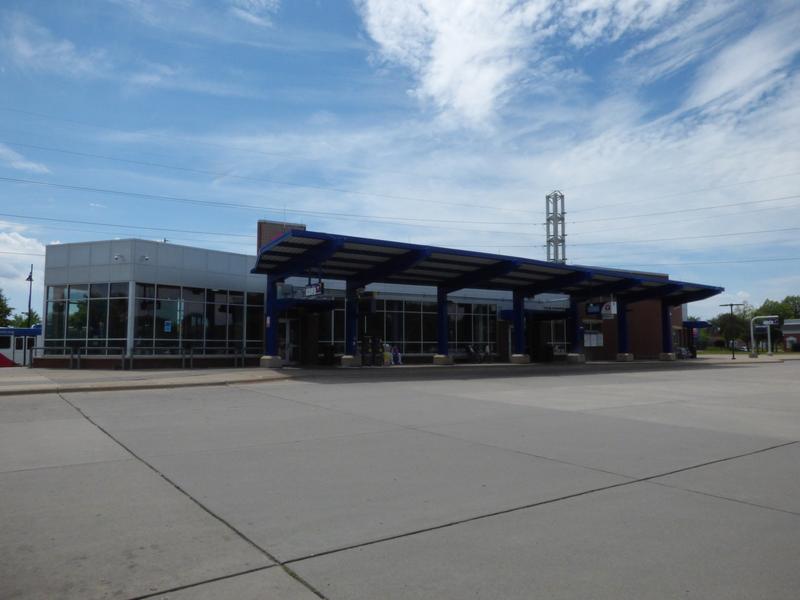
742 violent crimes /100k · 2,459 property crimes /100k · #2 most violent in Minnesota
 Located in
Hennepin County, Minnesota
Located in
Hennepin County, Minnesota
So the other Brooklyn is just across the bridge from Manhattan — one of the most iconic urban areas in the country. Brooklyn Center sits just north of Minneapolis. Sure, that’s the largest metro area in Minnesota … but not quite the same thing.
Still, this suburb has its charms, from golf courses to parks along the Mississippi River. However, it also has its drawbacks. And, no, we aren’t talking about the arctic winters. (Though it has those too.) Rather, Brooklyn Center has a high crime rate. This includes 228 car thefts and 75 robberies in a population of 31,522 people.
Data | Crime | Cost of living | Movers
343 violent crimes /100k · 3,467 property crimes /100k · #14 most violent in Minnesota
 Located in
Stearns County, Minnesota
Located in
Stearns County, Minnesota
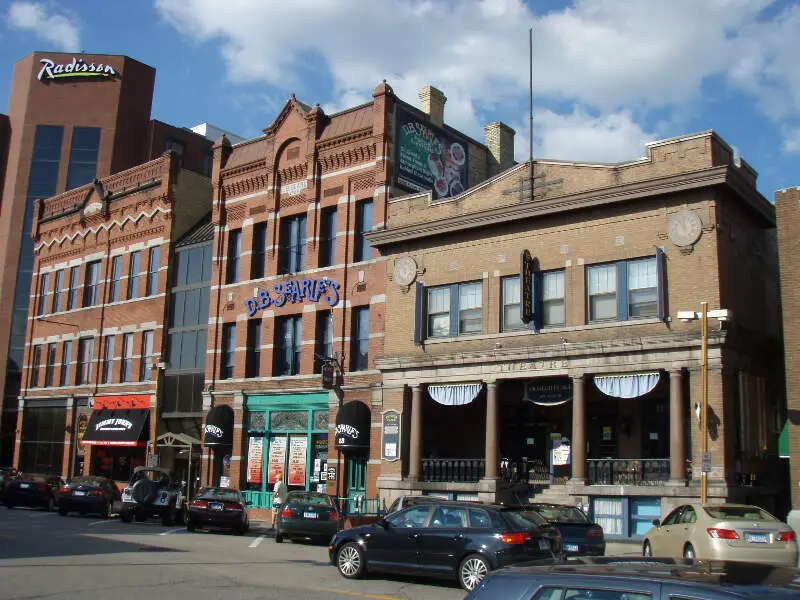
The largest population center in central Minnesota, St. Cloud has gone up 1 places on this list since last year, so things are looking up. Unfortunately, it’s still one of the poorest cities in Minnesota, so the root causes of criminal activity persist.
You might need to stop by at one of St. Clouds peaceful gardens to catch your breath, what with all the violent crime going down.
St. Cloud had the 28th highest rate of rape cases in Minnesota for 2024. Overall, residents had a 1 in 291 shot of being violently attacked.
Data | Crime | Cost of living | Movers
380 violent crimes /100k · 3,089 property crimes /100k · #11 most violent in Minnesota
 Located in
Ramsey County, Minnesota
Located in
Ramsey County, Minnesota
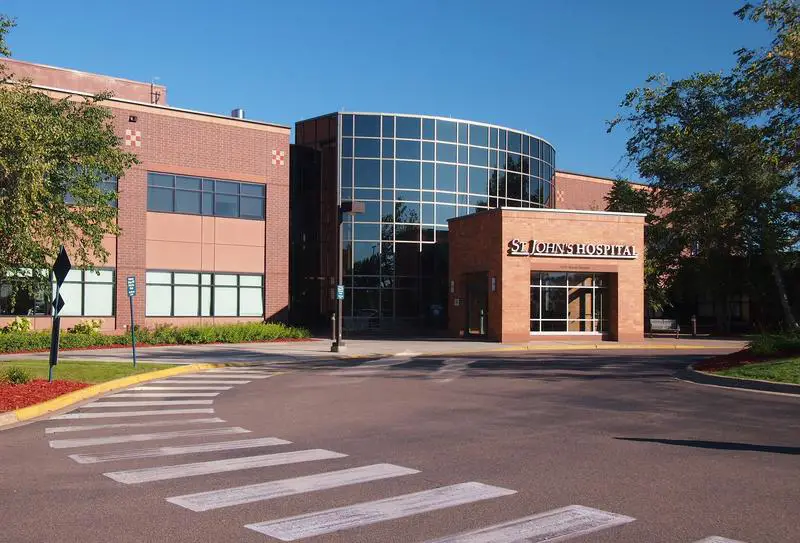
Look, we already named Maplewood as one of the Twin Cities’s worst suburbs, and a big reason why was Maplewood’s unimpressive crime statistics.
Be sure to keep an eye on your valuables if you go for a picnic in the park here, because Maplewood had 935 larcenies in 2024.
Also, lock your doors in Maplewood because the city had the tenth highest burglary rate in Minnesota. Overall, residents had a 1 in 32 chance of being the victim of a property crime over 2024.
Data | Crime | Cost of living | Movers
573 violent crimes /100k · 2,216 property crimes /100k · #4 most violent in Minnesota
 Located in
Crow Wing County, Minnesota
Located in
Crow Wing County, Minnesota
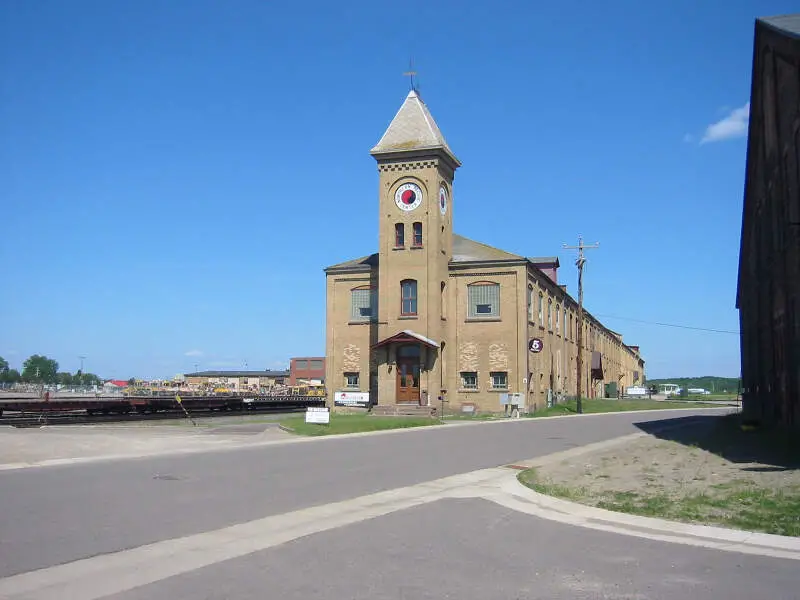
The county seat of Crow Wing County, Brainerd is known for its awesome lakes. Unfortunately, it’s also known for high rates of violent crime.
For starters, Brainerd had about 1.5 rape cases per month over 2024, giving it the highest rate of rape cases in Minnesota. Overall, residents had a 1 in 174 shot of being violently attacked over the year.
Some of that’s due to a fairly regular stream of tourists, but it doesn’t change the fact that a lot of crime goes down relative to Brainerd’s native population.
Data | Crime | Cost of living | Movers
382 violent crimes /100k · 2,751 property crimes /100k · #10 most violent in Minnesota
 Located in
Hennepin County, Minnesota
Located in
Hennepin County, Minnesota
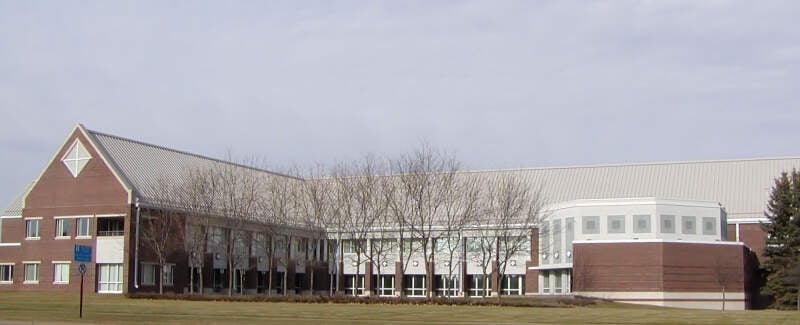
Brooklyn Park, a suburban city in Hennepin County, Minnesota, has earned a reputation as one of the state’s most dangerous places to live. With a population of 81,920, Brooklyn Park has experienced a concerning level of crime in recent years. The city recorded 313 violent crimes, including 7 murders, 43 rapes, 82 robberies, and 181 aggravated assaults in 2026.
These crime statistics paint a troubling picture of safety in Brooklyn Park. The high incidence of violent crime per capita, which stands at 382/100k, contributes to its ranking as the tenth most dangerous place to live in the state.
Data | Crime | Cost of living | Movers
308 violent crimes /100k · 3,924 property crimes /100k · #19 most violent in Minnesota
 Located in
Hennepin County, Minnesota
Located in
Hennepin County, Minnesota
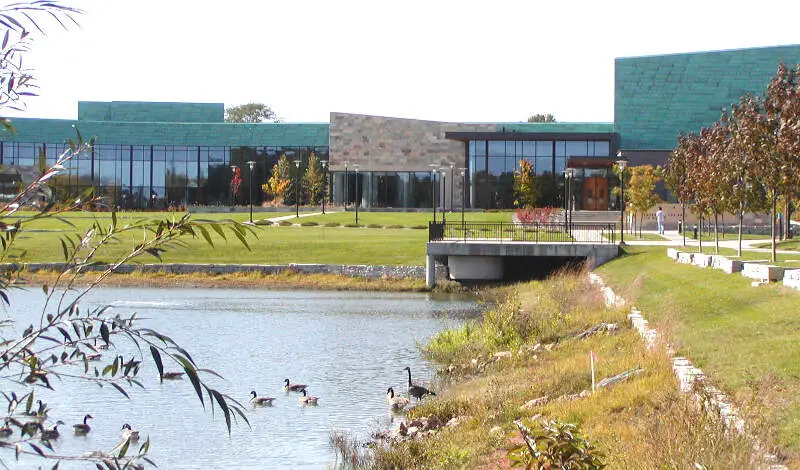
Bloomington is the fifth largest city, as of 2016 estimates, in the U.S. state of Minnesota. It is located in Hennepin County on the north bank of the Minnesota River, above its confluence with the Mississippi River. Bloomington lies 10 miles south of downtown Minneapolis. As of the 2010 census the city’s population was 82,893, and in 2016 the estimated population was 85,319.
Data | Crime | Cost of living | Movers
271 violent crimes /100k · 5,772 property crimes /100k · #24 most violent in Minnesota
 Located in
Ramsey County, Minnesota
Located in
Ramsey County, Minnesota
Poor Minneapolis. The area surrounding the city dominates this list. Here, yet again, sits another of the state’s most dangerous areas.
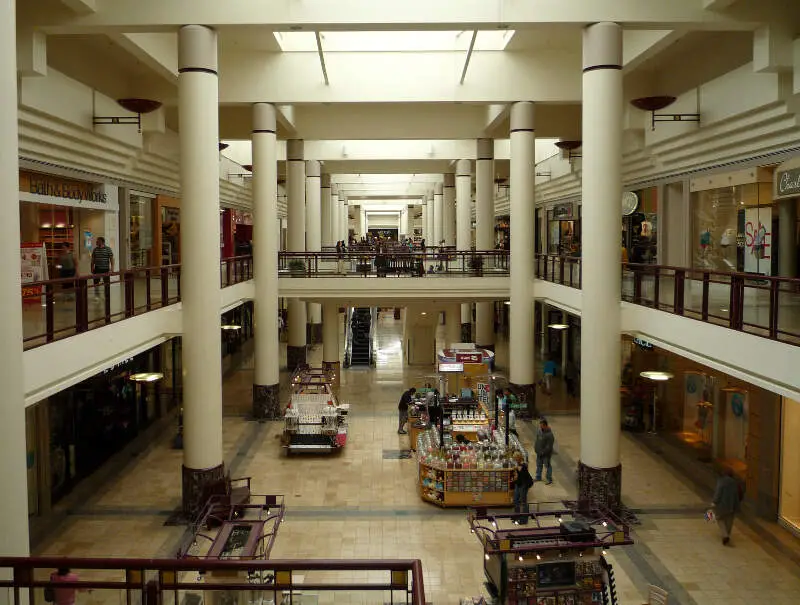
Roseville lies to the northeast of the city center, about 15 minutes from downtown. The community itself began building up in the 1940s and saw massive growth in the 1950s and 1960s. Lately, the area’s history has become more troubled. Violence remains relatively rare, but property crime rates have reached epidemic proportions. This includes 131 burglaries and 32 robberies in a population of 35,466. Roseville suffers a large number of car thefts as well.
Data | Crime | Cost of living | Movers
The receipts
Compare the top ten
Pick a metric. The bars rescale. The red line is Minnesota’s statewide median.
On the map
Where crime hits hardest in Minnesota
Saturday Night Science
How we determined the most dangerous cities in Minnesota for 2026?
Every year the FBI release two crime datasets on cities in Minnesota. First a preliminary dataset limited to the biggest cities in Minnesota, followed by a more detailed release at the end of the year.
For our analysis, we focused on the 2024 data, specifically the 2024 Crime In The United States Report for Minnesota.
So what criteria did we use? Have a look:
- Violent Crimes Per Capita
- Property Crimes Per Capita
In order to make the analysis as apples to apples as possible, we only considered Minnesota cities over 5,000 in population. That left us with 128 cities in Minnesota.
We then ranked each city from 1 to 128 for the two criteria with a #1 ranking being the most dangerous for the particular criteria.
Next, we averaged the two rankings into one “Dangerous Index”.
Finally, we ranked every city on the “Dangerous Index” with the lowest index being the most dangerous in Minnesota — Minneapolis. Any ties went to the smaller city.
This article is an opinion based on facts and is meant as infotainment. It is our eleventh time ranking the most dangerous places to live in Minnesota and is updated for 2026.
The full plate
Crime By City In Minnesota
Click any column to sort. Search by city name.
| Rank | City | Dangerous Index | Population | Total Crimes Per 100K | Violent Crimes Per 100K | Property Crimes Per 100K | Murders |
|---|---|---|---|---|---|---|---|
| 1 | Minneapolis | 2.50 | 422,341 | 6,384 | 1,132 | 5,253 | 72 |
| 2 | Bemidji | 4.00 | 16,221 | 6,615 | 481 | 6,134 | 2 |
| 3 | St. Paul | 6.50 | 300,368 | 3,714 | 624 | 3,090 | 27 |
| 4 | Brooklyn Center | 10.50 | 31,522 | 3,201 | 742 | 2,459 | 5 |
| 5 | St. Cloud | 10.50 | 69,922 | 3,810 | 343 | 3,467 | 3 |
| 6 | Maplewood | 11.00 | 39,170 | 3,469 | 380 | 3,089 | 0 |
| 7 | Brainerd | 12.00 | 14,666 | 2,789 | 573 | 2,216 | 0 |
| 8 | Brooklyn Park | 12.00 | 81,920 | 3,134 | 382 | 2,751 | 7 |
| 9 | Bloomington | 12.50 | 86,793 | 4,232 | 308 | 3,924 | 3 |
| 10 | Roseville | 13.50 | 35,466 | 6,042 | 271 | 5,772 | 3 |
| 11 | Fridley | 15.50 | 30,656 | 3,686 | 274 | 3,412 | 2 |
| 12 | Mankato | 16.50 | 45,431 | 3,119 | 299 | 2,820 | 0 |
| 13 | Virginia | 18.00 | 8,294 | 2,448 | 374 | 2,074 | 0 |
| 14 | Duluth | 18.50 | 86,570 | 3,178 | 265 | 2,913 | 1 |
| 15 | Crystal | 19.50 | 21,792 | 2,418 | 326 | 2,093 | 0 |
| 16 | Waite Park | 20.00 | 8,377 | 7,377 | 203 | 7,174 | 1 |
| 17 | Robbinsdale | 22.50 | 14,027 | 2,260 | 364 | 1,896 | 0 |
| 18 | Fergus Falls | 22.50 | 14,223 | 2,812 | 260 | 2,552 | 0 |
| 19 | West St. Paul | 22.50 | 22,442 | 4,398 | 201 | 4,197 | 0 |
| 20 | Moorhead | 22.50 | 45,026 | 2,312 | 515 | 1,797 | 2 |
| 21 | Burnsville | 27.00 | 63,650 | 2,269 | 264 | 2,005 | 1 |
| 22 | Richfield | 27.50 | 36,607 | 2,352 | 235 | 2,117 | 0 |
| 23 | Albert Lea | 28.50 | 18,347 | 2,306 | 245 | 2,060 | 1 |
| 24 | Hopkins | 30.50 | 17,911 | 2,138 | 262 | 1,876 | 1 |
| 25 | Columbia Heights | 30.50 | 23,348 | 2,039 | 317 | 1,722 | 0 |
| 26 | Willmar | 31.00 | 21,410 | 2,022 | 439 | 1,583 | 0 |
| 27 | Apple Valley | 34.00 | 54,995 | 2,089 | 242 | 1,847 | 0 |
| 28 | South St. Paul | 35.50 | 20,403 | 1,897 | 309 | 1,588 | 1 |
| 29 | St. Anthony | 36.50 | 12,749 | 2,745 | 165 | 2,581 | 0 |
| 30 | Little Falls | 37.50 | 9,083 | 2,092 | 198 | 1,894 | 1 |
| 31 | Red Wing | 37.50 | 16,725 | 2,290 | 179 | 2,111 | 1 |
| 32 | Baxter | 38.00 | 9,142 | 2,680 | 164 | 2,516 | 0 |
| 33 | St. Louis Park | 38.50 | 48,241 | 3,447 | 141 | 3,306 | 1 |
| 34 | Worthington | 42.00 | 13,669 | 1,478 | 402 | 1,075 | 0 |
| 35 | Austin | 42.00 | 26,212 | 1,915 | 225 | 1,690 | 1 |
| 36 | International Falls | 42.50 | 5,605 | 1,534 | 339 | 1,195 | 0 |
| 37 | Crookston | 43.00 | 7,255 | 1,433 | 441 | 992 | 0 |
| 38 | Detroit Lakes | 43.00 | 10,009 | 1,888 | 220 | 1,668 | 0 |
| 39 | Fairmont | 43.00 | 10,164 | 1,909 | 207 | 1,702 | 0 |
| 40 | Winona | 43.50 | 25,770 | 2,224 | 151 | 2,072 | 1 |
| 41 | Anoka | 44.00 | 18,029 | 1,559 | 288 | 1,270 | 0 |
| 42 | Faribault | 44.00 | 24,557 | 1,666 | 252 | 1,413 | 0 |
| 43 | Inver Grove Heights | 45.00 | 35,640 | 1,981 | 180 | 1,801 | 0 |
| 44 | Rogers | 49.00 | 13,591 | 2,171 | 132 | 2,038 | 0 |
| 45 | Alexandria | 49.00 | 15,109 | 1,628 | 199 | 1,430 | 0 |
| 46 | Wayzata | 49.50 | 5,932 | 1,837 | 185 | 1,652 | 0 |
| 47 | Coon Rapids | 52.50 | 62,391 | 1,717 | 184 | 1,532 | 0 |
| 48 | Redwood Falls | 53.00 | 5,079 | 1,339 | 236 | 1,103 | 0 |
| 49 | Thief River Falls | 53.00 | 8,939 | 1,544 | 190 | 1,354 | 1 |
| 50 | Spring Lake Park | 53.50 | 7,029 | 1,935 | 142 | 1,793 | 0 |
| 51 | New Hope | 53.50 | 20,613 | 1,999 | 131 | 1,868 | 1 |
| 52 | White Bear Lake | 54.00 | 23,097 | 1,870 | 147 | 1,723 | 0 |
| 53 | Eagan | 54.50 | 66,943 | 2,091 | 111 | 1,981 | 1 |
| 54 | Hutchinson | 55.00 | 14,713 | 1,155 | 285 | 870 | 0 |
| 55 | Rochester | 55.50 | 122,035 | 1,754 | 162 | 1,592 | 1 |
| 56 | Oakdale | 56.50 | 27,565 | 1,850 | 141 | 1,709 | 0 |
| 57 | Cloquet | 57.00 | 12,619 | 1,133 | 254 | 880 | 0 |
| 58 | Mendota Heights | 57.50 | 11,363 | 1,470 | 185 | 1,285 | 0 |
| 59 | North Mankato | 57.50 | 14,229 | 1,321 | 197 | 1,124 | 0 |
| 60 | Hermantown | 59.50 | 10,081 | 2,688 | 69 | 2,619 | 0 |
| 61 | Glencoe | 61.00 | 5,646 | 1,258 | 195 | 1,063 | 0 |
| 62 | Maple Grove | 62.00 | 70,729 | 1,909 | 96 | 1,813 | 1 |
| 63 | North St. Paul | 63.00 | 12,866 | 1,477 | 148 | 1,329 | 1 |
| 64 | Owatonna | 64.00 | 26,501 | 1,098 | 189 | 909 | 1 |
| 65 | Waseca | 64.50 | 9,113 | 1,405 | 154 | 1,251 | 1 |
| 66 | Sauk Rapids | 64.50 | 13,753 | 1,651 | 131 | 1,520 | 0 |
| 67 | Mounds View | 65.00 | 12,368 | 1,253 | 178 | 1,075 | 0 |
| 68 | St. Joseph | 66.00 | 7,121 | 1,109 | 183 | 927 | 0 |
| 69 | Forest Lake | 66.00 | 20,936 | 1,844 | 91 | 1,753 | 1 |
| 70 | Shakopee | 66.50 | 46,597 | 1,453 | 135 | 1,318 | 0 |
| 71 | Hastings | 67.00 | 21,492 | 1,335 | 149 | 1,186 | 0 |
| 72 | Edina | 67.00 | 51,980 | 1,880 | 81 | 1,799 | 2 |
| 73 | Blaine | 69.00 | 72,384 | 1,804 | 86 | 1,719 | 0 |
| 74 | Lakes Area | 69.50 | 10,738 | 1,052 | 168 | 885 | 0 |
| 75 | Marshall | 69.50 | 13,726 | 860 | 211 | 648 | 1 |
| 76 | Cambridge | 70.50 | 10,908 | 1,999 | 55 | 1,944 | 0 |
| 77 | Wyoming | 71.50 | 8,066 | 1,054 | 161 | 893 | 1 |
| 78 | Minnetonka | 72.00 | 51,791 | 1,786 | 79 | 1,707 | 1 |
| 79 | Sartell | 73.00 | 19,862 | 1,984 | 50 | 1,933 | 1 |
| 80 | Prior Lake | 73.00 | 28,390 | 1,328 | 120 | 1,208 | 1 |
| 81 | New Brighton | 74.00 | 21,987 | 1,396 | 105 | 1,292 | 0 |
| 82 | Grand Rapids | 74.50 | 11,344 | 882 | 167 | 714 | 0 |
| 83 | Northfield | 74.50 | 20,997 | 1,110 | 138 | 972 | 0 |
| 84 | Becker | 82.00 | 5,046 | 991 | 119 | 872 | 0 |
| 85 | St. Paul Park | 82.00 | 5,371 | 689 | 186 | 503 | 0 |
| 86 | Litchfield | 82.00 | 6,589 | 956 | 121 | 835 | 0 |
| 87 | Eden Prairie | 83.50 | 61,645 | 1,450 | 62 | 1,389 | 1 |
| 88 | Elk River | 84.00 | 27,166 | 1,152 | 88 | 1,064 | 0 |
| 89 | Isanti | 86.00 | 7,372 | 922 | 109 | 814 | 0 |
| 90 | St. Francis | 87.00 | 8,496 | 789 | 129 | 659 | 0 |
| 91 | Woodbury | 87.00 | 80,153 | 1,357 | 59 | 1,299 | 0 |
| 92 | Plymouth | 88.50 | 77,576 | 1,159 | 71 | 1,088 | 2 |
| 93 | Savage | 89.00 | 33,051 | 911 | 94 | 817 | 0 |
| 94 | Princeton | 90.00 | 5,467 | 1,427 | 37 | 1,390 | 0 |
| 95 | St. Peter | 90.00 | 12,195 | 771 | 115 | 656 | 0 |
| 96 | Champlin | 90.50 | 22,750 | 954 | 84 | 870 | 0 |
| 97 | Centennial Lakes | 91.50 | 12,444 | 788 | 96 | 691 | 0 |
| 98 | Stillwater | 92.00 | 19,214 | 760 | 99 | 661 | 0 |
| 99 | Lakeville | 92.00 | 76,929 | 788 | 94 | 694 | 2 |
| 100 | Orono | 92.50 | 19,056 | 672 | 121 | 551 | 0 |
Source: FBI UCR 2024. 128 cities with more than 5,000 residents.
Summary
Summary: Locking It All Up In Minnesota
So what is the most dangerous city in Minnesota? After analyzing 128 cities in Minnesota, Minneapolis takes the top spot as the most dangerous city in Minnesota based on the most recently reported FBI data — 2024.
The latest FBI crime data shows that Minneapolis ranks as the most dangerous city in Minnesota for 2026.
The most dangerous cities in Minnesota are Minneapolis, Bemidji, St. Paul, Brooklyn Center, St. Cloud, Maplewood, Brainerd, Brooklyn Park, Bloomington, and Roseville.
We want to point out again that there’s still safes places in Minneapolis and that this isn’t a comment on the people that live there. So please don’t beat us up. Wondering how Minneapolis stacks up against a bigger name? See Minneapolis, MN vs. Indianapolis, IN side by side.
Questions and answers
Most Dangerous Places To Live In Minnesota FAQs
What is the most dangerous city in Minnesota?
Minneapolis is the most dangerous city in Minnesota for 2026, based on the most recent FBI crime data. It logs 1,132 violent crimes and 5,253 property crimes per 100,000 residents.
What are the 10 most dangerous cities in Minnesota?
The ten most dangerous cities in Minnesota are Minneapolis, Bemidji, St. Paul, Brooklyn Center, St. Cloud, Maplewood, Brainerd, Brooklyn Park, Bloomington, and Roseville. We ranked all 128 cities with more than 5,000 residents on violent and property crime per capita.
Is Minnesota a dangerous state?
Minnesota is the 29th most dangerous state in the United States by our national ranking. Statewide numbers hide a lot, though; the highest crime rates in Minnesota belong to Minneapolis, Bemidji, and St. Paul.
What is the safest city in Minnesota?
Montevideo is the safest city in Minnesota, posting the lowest crime rate of the 128 places we analyzed. The full most-dangerous-to-safest ordering is in the table above.
How do you decide which Minnesota cities are the most dangerous?
We take each city’s violent and property crimes from the latest FBI Uniform Crime Report, divide by population, and rank every place with more than 5,000 residents. The city with the highest combined rate, Minneapolis, comes out most dangerous for 2026.



