Edina SnackAbility
Overall SnackAbility
Crime in Edina summary. We use data from the FBI to determine the crime rates in Edina. Key points include:
There were 977 total crimes in Edina in the last reporting year.
The overall crime rate per 100,000 people in Edina is 1,879.6 / 100k people.
The violent crime rate per 100,000 people in Edina is 80.8 / 100k people.
The property crime rate per 100,000 people in Edina is 1,798.8 / 100k people.
Overall, crime in Edina is -11.31% below the national average.
Total Crimes
Below National Average
Crime In Edina Comparison Table
| Statistic | Count Raw |
Edina / 100k People |
Minnesota / 100k People |
National / 100k People |
|---|---|---|---|---|
| Total Crimes Per 100K | 977 | 1,879.6 | 1,862.9 | 2,119.2 |
| Violent Crime | 42 | 80.8 | 256.6 | 359.0 |
| Murder | 2 | 3.8 | 2.9 | 5.0 |
| Robbery | 15 | 28.9 | 48.9 | 61.0 |
| Aggravated Assault | 17 | 32.7 | 168.0 | 256.0 |
| Property Crime | 935 | 1,798.8 | 1,606.3 | 1,760.0 |
| Burglary | 119 | 228.9 | 184.7 | 229.0 |
| Larceny | 708 | 1,362.1 | 1,208.5 | 1,272.0 |
| Car Theft | 108 | 207.8 | 213.1 | 259.0 |
Source: FBI Uniform Crime Reporting (2024)
Cost of living in Edina summary. We use data on the cost of living to determine how expensive it is to live in Edina. Real estate prices drive most of the variance in cost of living around Minnesota. Key points include:
The cost of living in Edina is 141 with 100 being average.
The cost of living in Edina is 1.4x higher than the national average.
The median home value in Edina is $615,641.
The median income in Edina is $128,767.
Edina's Overall Cost Of Living
Higher Than The National Average
Cost Of Living In Edina Comparison Table
| Living Expense | Edina | Minnesota | National Average |
|---|---|---|---|
| Overall | 141 | 101 | 100 |
| Services | 102 | 101 | 100 |
| Groceries | 100 | 99 | 100 |
| Health | 238 | 99 | 100 |
| Housing | 100 | 101 | 100 |
| Transportation | 104 | 103 | 100 |
| Utilities | 106 | 101 | 100 |
Source: Cost of living index, normalized to US average = 100
Edina, MN Weather
The average high in Edina is 55.2° and the average low is 36.8°.
There are 63.8 days of precipitation each year.
Expect an average of 32.1 inches of precipitation each year with 53.5 inches of snow.
| Stat | Edina |
|---|---|
| Average Annual High | 55.2 |
| Average Annual Low | 36.8 |
| Annual Precipitation Days | 63.8 |
| Average Annual Precipitation | 32.1 |
| Average Annual Snowfall | 53.5 |
Average High
Days of Rain
Source: NOAA climate normals (30-year)
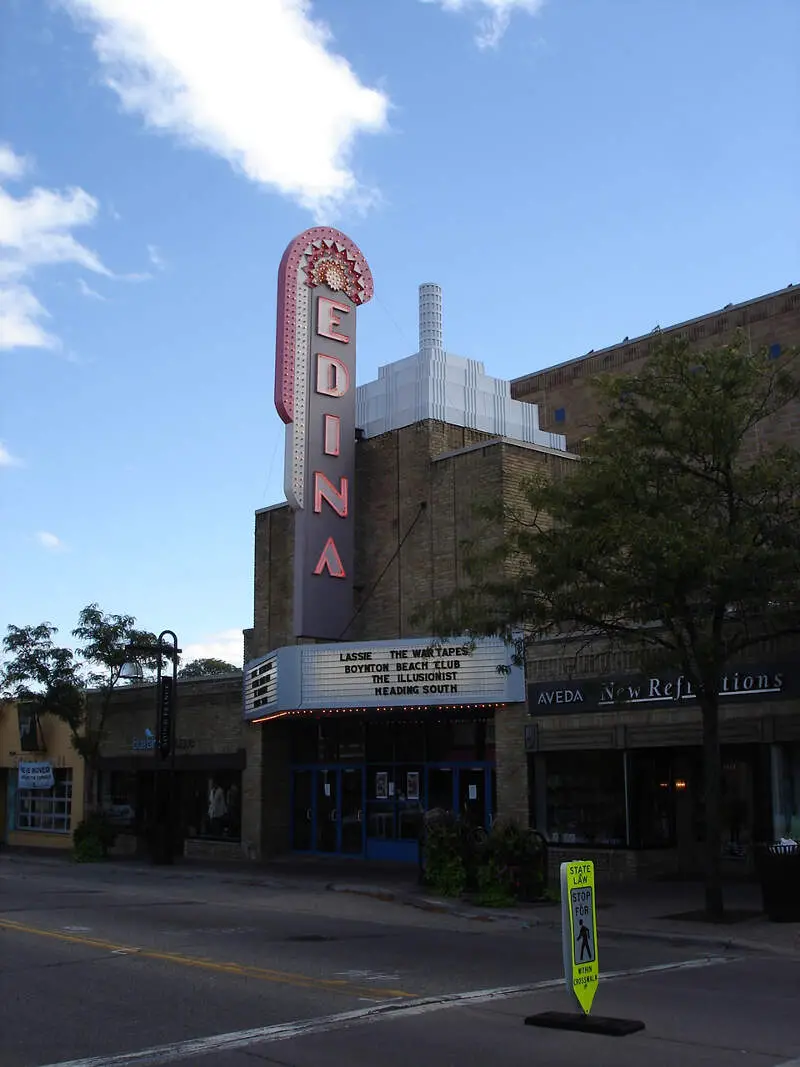
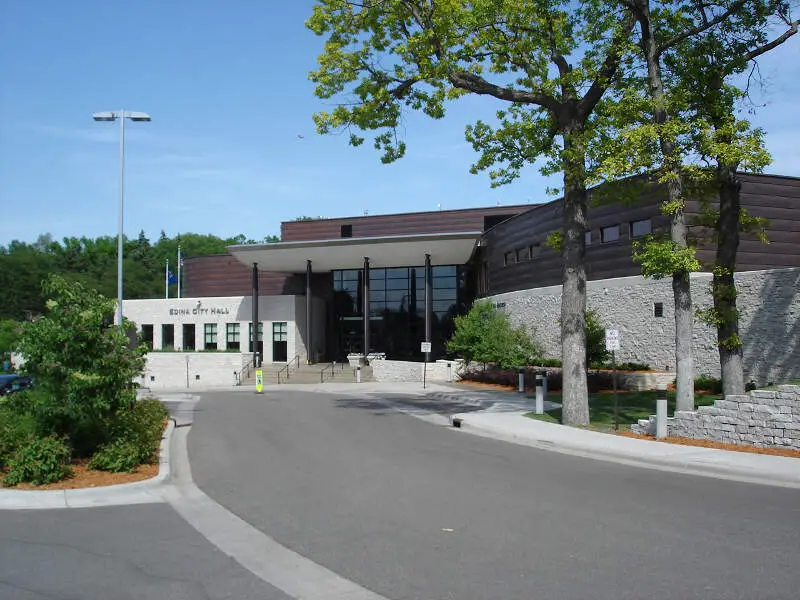
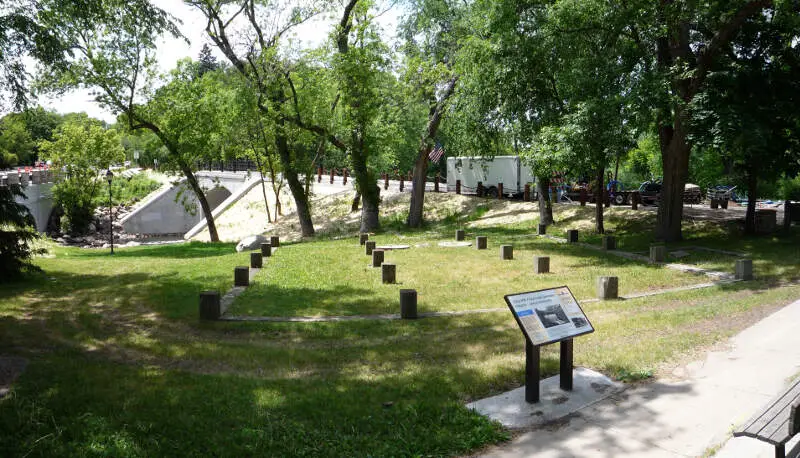
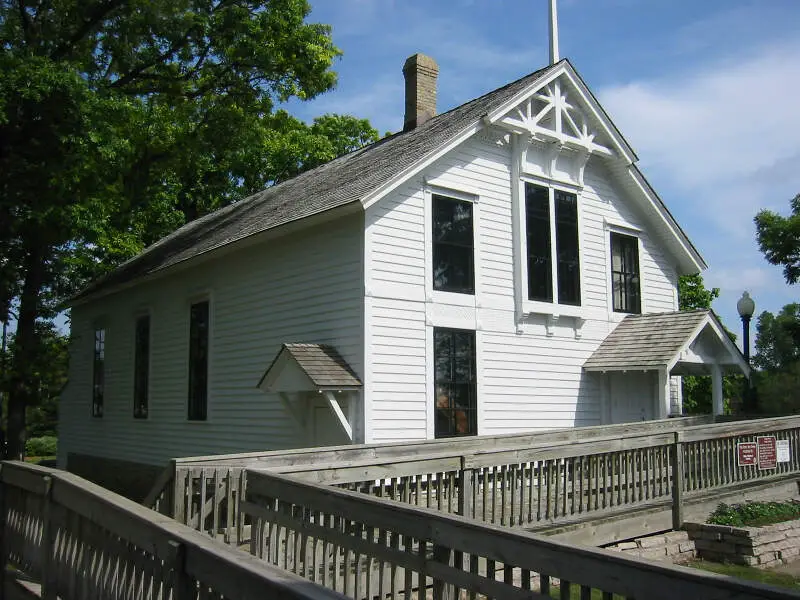
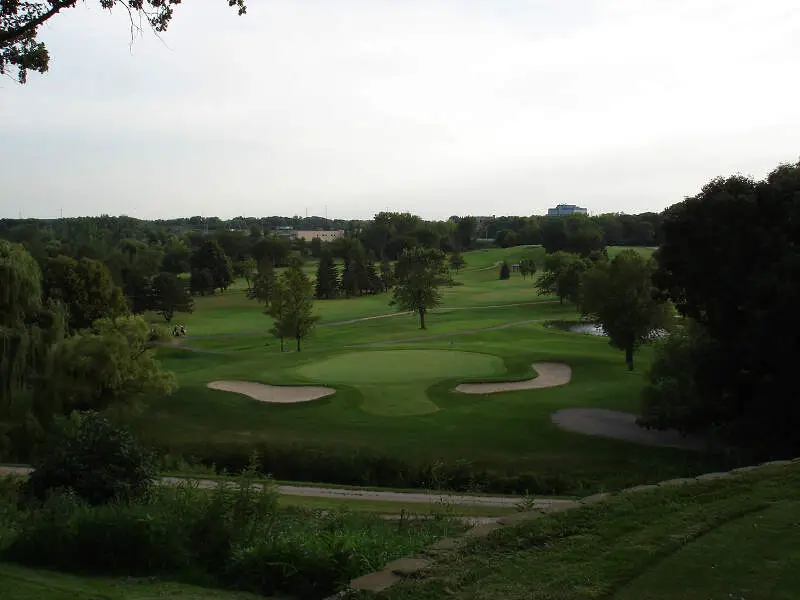
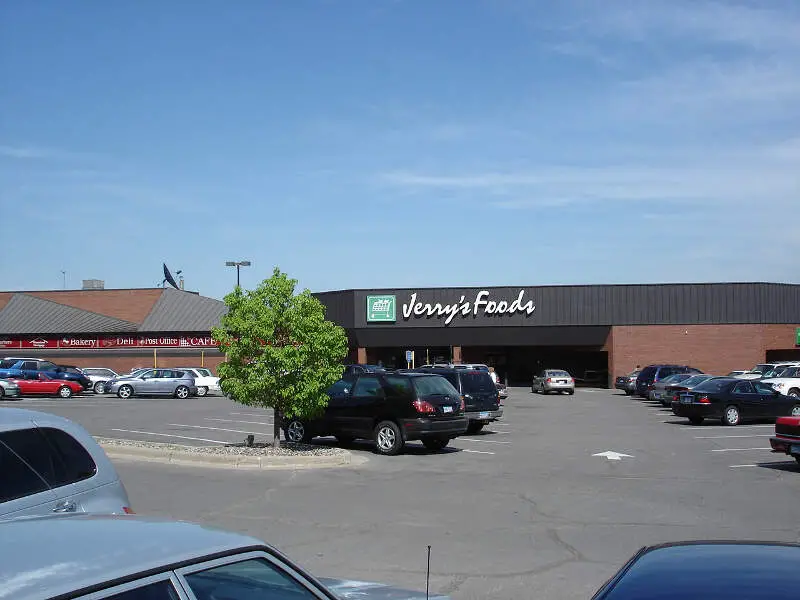
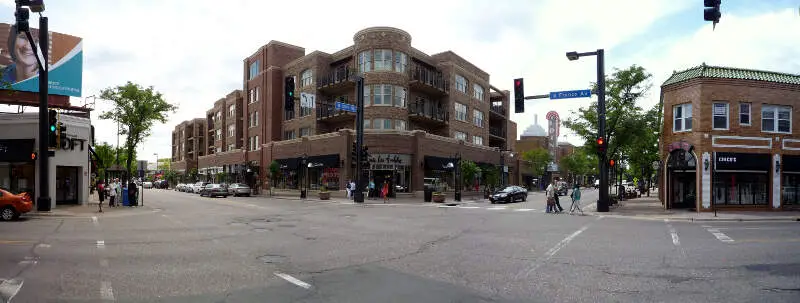
Edina, MN Photos

2 Reviews & Comments About Edina

It was the best of places, it was the worst of places. Like a lot of Minnesota, it's really somewhere in the middle. And that's Edina's big problem, in a nutshell: in a state of bland, inoffensive, passive-aggressive soccer moms, it's the try-hard city that cares more about style than substance. People from Edina do not *do* much of anything; they mostly just... exist. Preferably at the salon, or artisan coffee house, or highly overpriced grocery store, or failing that in a constant state of "gotta go!" en route from one activity desperately forced on offspring to help them seem interesting and relevant after another.
Edina occupies a convenient location, equidistant from all sorts of places anyone with two clues would much rather be. It's pretty, the crime is low, the schools are doubtless ever-so-slightly above par, probably in some ever-so-slightly unethical way. There are nice parks. If you're white and drive a minivan, you'll feel right at home. The problem with Edina, you should understand, isn't Edina itself. It's the people. People from Edina. They're bland and boring and self-obsessed. Drug-addled middle-managers, trophy wives, 2.4 heavily-medicated children per couple... they're the laughing stock of the Twin Cities. People from Edina; joke and punchline, all in one. They don't even get a neat name, like Minneapolitans, or Saint Paulites, or Little Canadians. Nope. People from Edina.
I hate Edina because I feel it is a stuck up city. The citizens are s****y and entitled there. It is full of ritzy, over-priced things that people don't really need.
The thing to watch out for are the people. The people working at the stores and restaurants were rude but also the residents and people on the streets were rude and judgmental.
Rankings & Articles For Edina


Locations Around Edina
Map Of Edina, MN
Best Places Around Edina
Maple Grove, MN
Population 71,173
Shoreview, MN
Population 26,714
Plymouth, MN
Population 79,220
Eden Prairie, MN
Population 63,051
Shorewood, MN
Population 7,647
Minnetonka, MN
Population 53,064
Lakeville, MN
Population 74,354
Minnetrista, MN
Population 8,708
Champlin, MN
Population 23,294
Mendota Heights, MN
Population 11,612
Edina Demographics And Statistics
Population over time in Edina
The current population in Edina is 53,262. The population has increased 12.3% from 2010.
| Year | Population | % Change |
|---|---|---|
| 2024 | 53,262 | 0.3% |
| 2023 | 53,125 | 0.2% |
| 2022 | 53,037 | -0.0% |
| 2021 | 53,059 | 1.6% |
| 2020 | 52,215 | 0.9% |
| 2019 | 51,746 | 1.2% |
| 2018 | 51,136 | 1.1% |
| 2017 | 50,603 | 1.3% |
| 2016 | 49,976 | 1.2% |
| 2015 | 49,373 | 0.9% |
| 2014 | 48,940 | 0.8% |
| 2013 | 48,574 | 0.9% |
| 2012 | 48,155 | 0.8% |
| 2011 | 47,790 | 0.7% |
| 2010 | 47,445 | - |
Race / Ethnicity in Edina
See the full breakdown
Edina is:
80.1% White with 42,658 White residents.
2.9% African American with 1,565 African American residents.
0.1% American Indian with 34 American Indian residents.
7.0% Asian with 3,715 Asian residents.
0.0% Hawaiian with 11 Hawaiian residents.
0.3% Other with 178 Other residents.
5.8% Two Or More with 3,075 Two Or More residents.
3.8% Hispanic with 2,026 Hispanic residents.
| Race | Edina | MN | USA |
|---|---|---|---|
| White | 80.1% | 75.9% | 57.4% |
| African American | 2.9% | 6.9% | 11.9% |
| American Indian | 0.1% | 0.7% | 0.5% |
| Asian | 7.0% | 5.1% | 5.9% |
| Hawaiian | 0.0% | 0.0% | 0.2% |
| Other | 0.3% | 0.5% | 0.6% |
| Two Or More | 5.8% | 4.5% | 4.3% |
| Hispanic | 3.8% | 6.4% | 19.3% |
Gender in Edina
See the full breakdown
Edina is 53.1% female with 28,273 female residents.
Edina is 46.9% male with 24,989 male residents.
| Gender | Edina | MN | USA |
|---|---|---|---|
| Female | 53.1% | 49.9% | 50.5% |
| Male | 46.9% | 50.1% | 49.5% |
Highest level of educational attainment in Edina for adults over 25
See the full breakdown
0.0% of adults in Edina completed < 9th grade.
1.0% of adults in Edina completed 9-12th grade.
8.0% of adults in Edina completed high school / ged.
11.0% of adults in Edina completed some college.
7.0% of adults in Edina completed associate's degree.
42.0% of adults in Edina completed bachelor's degree.
19.0% of adults in Edina completed master's degree.
8.0% of adults in Edina completed professional degree.
4.0% of adults in Edina completed doctorate degree.
| Education | Edina | MN | USA |
|---|---|---|---|
| < 9th Grade | 0.0% | 3.0% | 4.0% |
| 9-12th Grade | 1.0% | 3.0% | 6.0% |
| High School / GED | 8.0% | 23.0% | 26.0% |
| Some College | 11.0% | 19.0% | 19.0% |
| Associate's Degree | 7.0% | 12.0% | 9.0% |
| Bachelor's Degree | 42.0% | 26.0% | 22.0% |
| Master's Degree | 19.0% | 10.0% | 10.0% |
| Professional Degree | 8.0% | 2.0% | 2.0% |
| Doctorate Degree | 4.0% | 2.0% | 2.0% |
Household Income For Edina, Minnesota
See the full breakdown
3.6% of households in Edina earn Less than $10,000.
1.3% of households in Edina earn $10,000 to $14,999.
3.5% of households in Edina earn $15,000 to $24,999.
3.7% of households in Edina earn $25,000 to $34,999.
6.5% of households in Edina earn $35,000 to $49,999.
11.7% of households in Edina earn $50,000 to $74,999.
9.3% of households in Edina earn $75,000 to $99,999.
15.2% of households in Edina earn $100,000 to $149,999.
11.3% of households in Edina earn $150,000 to $199,999.
33.9% of households in Edina earn $200,000 or more.
| Income | Edina | MN | USA |
|---|---|---|---|
| Less than $10,000 | 3.6% | 3.8% | 5.0% |
| $10,000 to $14,999 | 1.3% | 2.7% | 3.4% |
| $15,000 to $24,999 | 3.5% | 5.2% | 6.3% |
| $25,000 to $34,999 | 3.7% | 5.6% | 6.6% |
| $35,000 to $49,999 | 6.5% | 9.3% | 10.1% |
| $50,000 to $74,999 | 11.7% | 15.6% | 15.5% |
| $75,000 to $99,999 | 9.3% | 13.2% | 12.6% |
| $100,000 to $149,999 | 15.2% | 19.6% | 17.5% |
| $150,000 to $199,999 | 11.3% | 11.2% | 9.6% |
| $200,000 or more | 33.9% | 13.8% | 13.4% |
Source: U.S. Census ACS 5-year estimates (2024)


