Hibbing SnackAbility
Overall SnackAbility
Crime in Hibbing summary. We use data from the FBI to determine the crime rates in Hibbing. Key points include:
There were 101 total crimes in Hibbing in the last reporting year.
The overall crime rate per 100,000 people in Hibbing is 631.6 / 100k people.
The violent crime rate per 100,000 people in Hibbing is 0.0 / 100k people.
The property crime rate per 100,000 people in Hibbing is 631.6 / 100k people.
Overall, crime in Hibbing is -70.20% below the national average.
Total Crimes
Below National Average
Crime In Hibbing Comparison Table
| Statistic | Count Raw |
Hibbing / 100k People |
Minnesota / 100k People |
National / 100k People |
|---|---|---|---|---|
| Total Crimes Per 100K | 101 | 631.6 | 1,862.9 | 2,119.2 |
| Violent Crime | 0 | 0.0 | 256.6 | 359.0 |
| Murder | 0 | 0.0 | 2.9 | 5.0 |
| Robbery | 0 | 0.0 | 48.9 | 61.0 |
| Aggravated Assault | 0 | 0.0 | 168.0 | 256.0 |
| Property Crime | 101 | 631.6 | 1,606.3 | 1,760.0 |
| Burglary | 0 | 0.0 | 184.7 | 229.0 |
| Larceny | 86 | 537.8 | 1,208.5 | 1,272.0 |
| Car Theft | 15 | 93.8 | 213.1 | 259.0 |
Source: FBI Uniform Crime Reporting (2024)
Cost of living in Hibbing summary. We use data on the cost of living to determine how expensive it is to live in Hibbing. Real estate prices drive most of the variance in cost of living around Minnesota. Key points include:
The cost of living in Hibbing is 87 with 100 being average.
The cost of living in Hibbing is 0.9x lower than the national average.
The median home value in Hibbing is $154,907.
The median income in Hibbing is $55,789.
Hibbing's Overall Cost Of Living
Lower Than The National Average
Cost Of Living In Hibbing Comparison Table
| Living Expense | Hibbing | Minnesota | National Average |
|---|---|---|---|
| Overall | 87 | 101 | 100 |
| Services | 101 | 101 | 100 |
| Groceries | 100 | 99 | 100 |
| Health | 60 | 99 | 100 |
| Housing | 105 | 101 | 100 |
| Transportation | 108 | 103 | 100 |
| Utilities | 97 | 101 | 100 |
Source: Cost of living index, normalized to US average = 100
Hibbing, MN Weather
The average high in Hibbing is 49.8° and the average low is 29.1°.
There are 55.7 days of precipitation each year.
Expect an average of 28.9 inches of precipitation each year with 59.2 inches of snow.
| Stat | Hibbing |
|---|---|
| Average Annual High | 49.8 |
| Average Annual Low | 29.1 |
| Annual Precipitation Days | 55.7 |
| Average Annual Precipitation | 28.9 |
| Average Annual Snowfall | 59.2 |
Average High
Days of Rain
Source: NOAA climate normals (30-year)
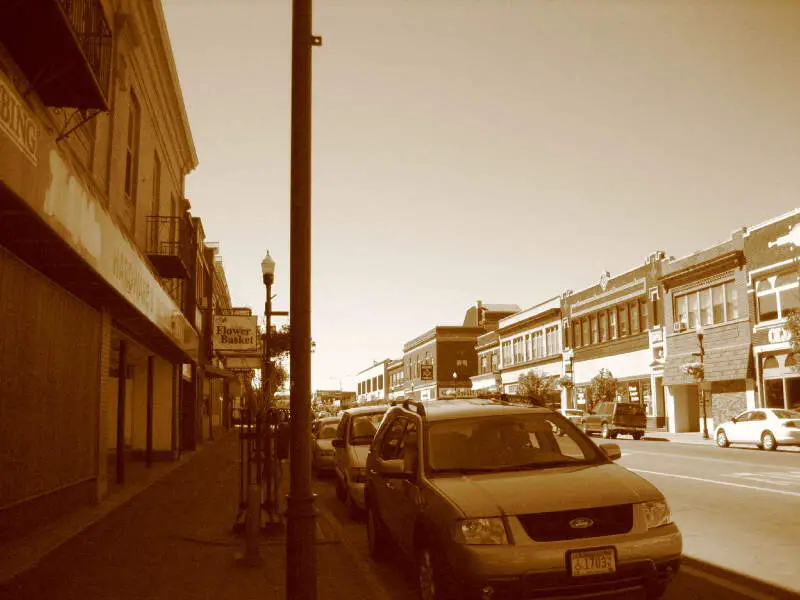
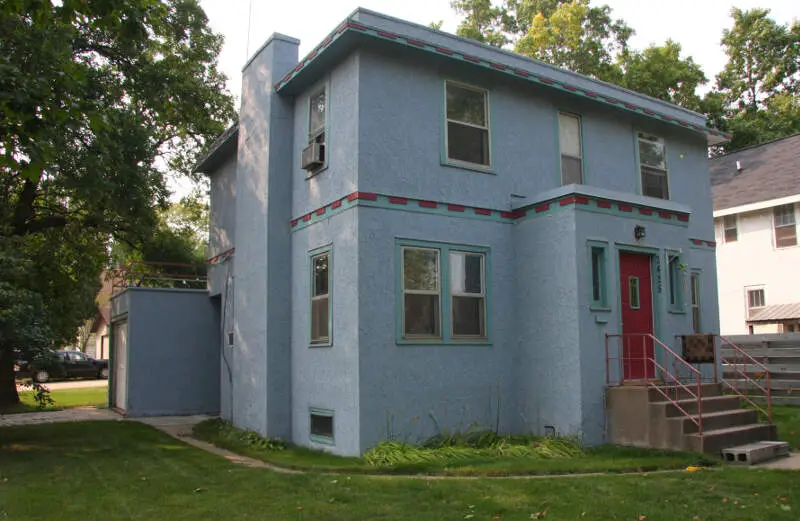
Hibbing, MN Photos
1 Reviews & Comments About Hibbing

I live in Hibbing mn, even though it wasn't listed this town has very rude people who live here. If you're not born and raised here you are not aaccepted. And that goes for the higher paying jobs, my husband who has his bachelors degree in business was never hired for any job locally because one of the questions during the interview was did you grow up in Hibbing- I mean really- What does that have to do with your qualifications--- Any ways he's works 1.5 hours away from Hibbing and drives it everyday.... People in Hibbing are snobs!! Just my opinion...
Rankings & Articles For Hibbing


Locations Around Hibbing
Map Of Hibbing, MN
Hibbing Demographics And Statistics
Population over time in Hibbing
The current population in Hibbing is 16,057. The population has decreased 2.1% from 2010.
| Year | Population | % Change |
|---|---|---|
| 2024 | 16,057 | -0.3% |
| 2023 | 16,100 | -0.4% |
| 2022 | 16,167 | -0.4% |
| 2021 | 16,224 | 1.9% |
| 2020 | 15,923 | -0.6% |
| 2019 | 16,014 | -0.6% |
| 2018 | 16,106 | -0.5% |
| 2017 | 16,183 | -0.3% |
| 2016 | 16,230 | -0.3% |
| 2015 | 16,284 | -0.3% |
| 2014 | 16,330 | 0.0% |
| 2013 | 16,329 | -0.1% |
| 2012 | 16,345 | -0.3% |
| 2011 | 16,395 | -0.0% |
| 2010 | 16,396 | - |
Race / Ethnicity in Hibbing
See the full breakdown
Hibbing is:
93.3% White with 14,981 White residents.
2.0% African American with 315 African American residents.
0.1% American Indian with 15 American Indian residents.
0.2% Asian with 35 Asian residents.
0.0% Hawaiian with 0 Hawaiian residents.
0.3% Other with 46 Other residents.
2.6% Two Or More with 411 Two Or More residents.
1.6% Hispanic with 254 Hispanic residents.
| Race | Hibbing | MN | USA |
|---|---|---|---|
| White | 93.3% | 75.9% | 57.4% |
| African American | 2.0% | 6.9% | 11.9% |
| American Indian | 0.1% | 0.7% | 0.5% |
| Asian | 0.2% | 5.1% | 5.9% |
| Hawaiian | 0.0% | 0.0% | 0.2% |
| Other | 0.3% | 0.5% | 0.6% |
| Two Or More | 2.6% | 4.5% | 4.3% |
| Hispanic | 1.6% | 6.4% | 19.3% |
Gender in Hibbing
See the full breakdown
Hibbing is 51.4% female with 8,260 female residents.
Hibbing is 48.6% male with 7,797 male residents.
| Gender | Hibbing | MN | USA |
|---|---|---|---|
| Female | 51.4% | 49.9% | 50.5% |
| Male | 48.6% | 50.1% | 49.5% |
Highest level of educational attainment in Hibbing for adults over 25
See the full breakdown
4.0% of adults in Hibbing completed < 9th grade.
6.0% of adults in Hibbing completed 9-12th grade.
30.0% of adults in Hibbing completed high school / ged.
28.0% of adults in Hibbing completed some college.
14.0% of adults in Hibbing completed associate's degree.
13.0% of adults in Hibbing completed bachelor's degree.
4.0% of adults in Hibbing completed master's degree.
1.0% of adults in Hibbing completed professional degree.
0.0% of adults in Hibbing completed doctorate degree.
| Education | Hibbing | MN | USA |
|---|---|---|---|
| < 9th Grade | 4.0% | 3.0% | 4.0% |
| 9-12th Grade | 6.0% | 3.0% | 6.0% |
| High School / GED | 30.0% | 23.0% | 26.0% |
| Some College | 28.0% | 19.0% | 19.0% |
| Associate's Degree | 14.0% | 12.0% | 9.0% |
| Bachelor's Degree | 13.0% | 26.0% | 22.0% |
| Master's Degree | 4.0% | 10.0% | 10.0% |
| Professional Degree | 1.0% | 2.0% | 2.0% |
| Doctorate Degree | 0.0% | 2.0% | 2.0% |
Household Income For Hibbing, Minnesota
See the full breakdown
8.2% of households in Hibbing earn Less than $10,000.
4.5% of households in Hibbing earn $10,000 to $14,999.
8.5% of households in Hibbing earn $15,000 to $24,999.
9.9% of households in Hibbing earn $25,000 to $34,999.
11.8% of households in Hibbing earn $35,000 to $49,999.
19.3% of households in Hibbing earn $50,000 to $74,999.
13.3% of households in Hibbing earn $75,000 to $99,999.
13.7% of households in Hibbing earn $100,000 to $149,999.
8.1% of households in Hibbing earn $150,000 to $199,999.
2.6% of households in Hibbing earn $200,000 or more.
| Income | Hibbing | MN | USA |
|---|---|---|---|
| Less than $10,000 | 8.2% | 3.8% | 5.0% |
| $10,000 to $14,999 | 4.5% | 2.7% | 3.4% |
| $15,000 to $24,999 | 8.5% | 5.2% | 6.3% |
| $25,000 to $34,999 | 9.9% | 5.6% | 6.6% |
| $35,000 to $49,999 | 11.8% | 9.3% | 10.1% |
| $50,000 to $74,999 | 19.3% | 15.6% | 15.5% |
| $75,000 to $99,999 | 13.3% | 13.2% | 12.6% |
| $100,000 to $149,999 | 13.7% | 19.6% | 17.5% |
| $150,000 to $199,999 | 8.1% | 11.2% | 9.6% |
| $200,000 or more | 2.6% | 13.8% | 13.4% |
Source: U.S. Census ACS 5-year estimates (2024)


