New Ulm SnackAbility
Overall SnackAbility
Crime in New Ulm summary. We use data from the FBI to determine the crime rates in New Ulm. Key points include:
There were 75 total crimes in New Ulm in the last reporting year.
The overall crime rate per 100,000 people in New Ulm is 536.1 / 100k people.
The violent crime rate per 100,000 people in New Ulm is 28.6 / 100k people.
The property crime rate per 100,000 people in New Ulm is 507.5 / 100k people.
Overall, crime in New Ulm is -74.71% below the national average.
Total Crimes
Below National Average
Crime In New Ulm Comparison Table
| Statistic | Count Raw |
New Ulm / 100k People |
Minnesota / 100k People |
National / 100k People |
|---|---|---|---|---|
| Total Crimes Per 100K | 75 | 536.1 | 1,862.9 | 2,119.2 |
| Violent Crime | 4 | 28.6 | 256.6 | 359.0 |
| Murder | 0 | 0.0 | 2.9 | 5.0 |
| Robbery | 0 | 0.0 | 48.9 | 61.0 |
| Aggravated Assault | 2 | 14.3 | 168.0 | 256.0 |
| Property Crime | 71 | 507.5 | 1,606.3 | 1,760.0 |
| Burglary | 4 | 28.6 | 184.7 | 229.0 |
| Larceny | 63 | 450.3 | 1,208.5 | 1,272.0 |
| Car Theft | 4 | 28.6 | 213.1 | 259.0 |
Source: FBI Uniform Crime Reporting (2024)
Cost of living in New Ulm summary. We use data on the cost of living to determine how expensive it is to live in New Ulm. Real estate prices drive most of the variance in cost of living around Minnesota. Key points include:
The cost of living in New Ulm is 94 with 100 being average.
The cost of living in New Ulm is 0.9x lower than the national average.
The median home value in New Ulm is $244,182.
The median income in New Ulm is $64,449.
New Ulm's Overall Cost Of Living
Lower Than The National Average
Cost Of Living In New Ulm Comparison Table
| Living Expense | New Ulm | Minnesota | National Average |
|---|---|---|---|
| Overall | 94 | 101 | 100 |
| Services | 101 | 101 | 100 |
| Groceries | 100 | 99 | 100 |
| Health | 80 | 99 | 100 |
| Housing | 97 | 101 | 100 |
| Transportation | 104 | 103 | 100 |
| Utilities | 100 | 101 | 100 |
Source: Cost of living index, normalized to US average = 100
New Ulm, MN Weather
The average high in New Ulm is 55.5° and the average low is 35.5°.
There are 56.3 days of precipitation each year.
Expect an average of 29.3 inches of precipitation each year with 39.6 inches of snow.
| Stat | New Ulm |
|---|---|
| Average Annual High | 55.5 |
| Average Annual Low | 35.5 |
| Annual Precipitation Days | 56.3 |
| Average Annual Precipitation | 29.3 |
| Average Annual Snowfall | 39.6 |
Average High
Days of Rain
Source: NOAA climate normals (30-year)
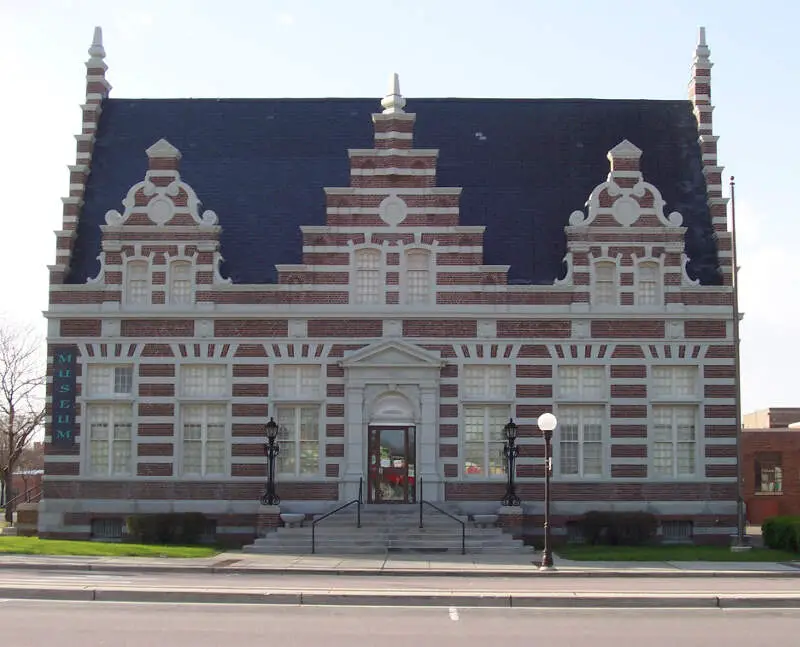
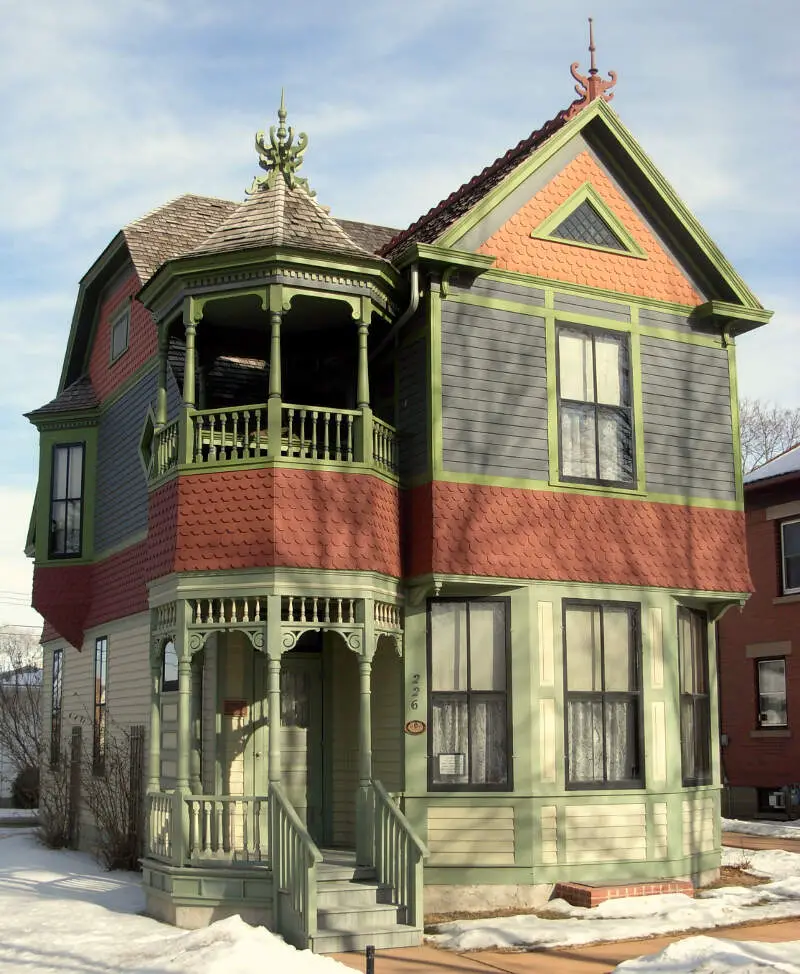
New Ulm, MN Photos


Rankings & Articles For New Ulm


Locations Around New Ulm
Map Of New Ulm, MN
Best Places Around New Ulm
North Mankato, MN
Population 14,211
Waconia, MN
Population 13,434
St. Peter, MN
Population 12,185
Jordan, MN
Population 6,771
New Prague, MN
Population 8,237
Belle Plaine, MN
Population 7,423
Mankato, MN
Population 45,473
Fairmont, MN
Population 10,296
Hutchinson, MN
Population 14,680
Glencoe, MN
Population 5,695
New Ulm Demographics And Statistics
Population over time in New Ulm
The current population in New Ulm is 14,056. The population has increased 4.0% from 2010.
| Year | Population | % Change |
|---|---|---|
| 2024 | 14,056 | -0.1% |
| 2023 | 14,066 | 0.1% |
| 2022 | 14,055 | 0.0% |
| 2021 | 14,052 | 6.4% |
| 2020 | 13,209 | -0.2% |
| 2019 | 13,242 | -0.0% |
| 2018 | 13,248 | -0.0% |
| 2017 | 13,249 | -0.2% |
| 2016 | 13,279 | -0.1% |
| 2015 | 13,287 | -0.3% |
| 2014 | 13,328 | -0.3% |
| 2013 | 13,372 | -0.5% |
| 2012 | 13,435 | -0.4% |
| 2011 | 13,493 | -0.1% |
| 2010 | 13,509 | - |
Race / Ethnicity in New Ulm
See the full breakdown
New Ulm is:
93.6% White with 13,150 White residents.
0.8% African American with 108 African American residents.
0.2% American Indian with 33 American Indian residents.
0.7% Asian with 100 Asian residents.
0.0% Hawaiian with 0 Hawaiian residents.
0.4% Other with 63 Other residents.
0.9% Two Or More with 132 Two Or More residents.
3.3% Hispanic with 470 Hispanic residents.
| Race | New Ulm | MN | USA |
|---|---|---|---|
| White | 93.6% | 75.9% | 57.4% |
| African American | 0.8% | 6.9% | 11.9% |
| American Indian | 0.2% | 0.7% | 0.5% |
| Asian | 0.7% | 5.1% | 5.9% |
| Hawaiian | 0.0% | 0.0% | 0.2% |
| Other | 0.4% | 0.5% | 0.6% |
| Two Or More | 0.9% | 4.5% | 4.3% |
| Hispanic | 3.3% | 6.4% | 19.3% |
Gender in New Ulm
See the full breakdown
New Ulm is 50.8% female with 7,138 female residents.
New Ulm is 49.2% male with 6,918 male residents.
| Gender | New Ulm | MN | USA |
|---|---|---|---|
| Female | 50.8% | 49.9% | 50.5% |
| Male | 49.2% | 50.1% | 49.5% |
Highest level of educational attainment in New Ulm for adults over 25
See the full breakdown
4.0% of adults in New Ulm completed < 9th grade.
5.0% of adults in New Ulm completed 9-12th grade.
33.0% of adults in New Ulm completed high school / ged.
19.0% of adults in New Ulm completed some college.
11.0% of adults in New Ulm completed associate's degree.
17.0% of adults in New Ulm completed bachelor's degree.
8.0% of adults in New Ulm completed master's degree.
2.0% of adults in New Ulm completed professional degree.
1.0% of adults in New Ulm completed doctorate degree.
| Education | New Ulm | MN | USA |
|---|---|---|---|
| < 9th Grade | 4.0% | 3.0% | 4.0% |
| 9-12th Grade | 5.0% | 3.0% | 6.0% |
| High School / GED | 33.0% | 23.0% | 26.0% |
| Some College | 19.0% | 19.0% | 19.0% |
| Associate's Degree | 11.0% | 12.0% | 9.0% |
| Bachelor's Degree | 17.0% | 26.0% | 22.0% |
| Master's Degree | 8.0% | 10.0% | 10.0% |
| Professional Degree | 2.0% | 2.0% | 2.0% |
| Doctorate Degree | 1.0% | 2.0% | 2.0% |
Household Income For New Ulm, Minnesota
See the full breakdown
4.6% of households in New Ulm earn Less than $10,000.
3.0% of households in New Ulm earn $10,000 to $14,999.
4.8% of households in New Ulm earn $15,000 to $24,999.
9.0% of households in New Ulm earn $25,000 to $34,999.
12.0% of households in New Ulm earn $35,000 to $49,999.
22.1% of households in New Ulm earn $50,000 to $74,999.
16.3% of households in New Ulm earn $75,000 to $99,999.
16.4% of households in New Ulm earn $100,000 to $149,999.
6.6% of households in New Ulm earn $150,000 to $199,999.
5.1% of households in New Ulm earn $200,000 or more.
| Income | New Ulm | MN | USA |
|---|---|---|---|
| Less than $10,000 | 4.6% | 3.8% | 5.0% |
| $10,000 to $14,999 | 3.0% | 2.7% | 3.4% |
| $15,000 to $24,999 | 4.8% | 5.2% | 6.3% |
| $25,000 to $34,999 | 9.0% | 5.6% | 6.6% |
| $35,000 to $49,999 | 12.0% | 9.3% | 10.1% |
| $50,000 to $74,999 | 22.1% | 15.6% | 15.5% |
| $75,000 to $99,999 | 16.3% | 13.2% | 12.6% |
| $100,000 to $149,999 | 16.4% | 19.6% | 17.5% |
| $150,000 to $199,999 | 6.6% | 11.2% | 9.6% |
| $200,000 or more | 5.1% | 13.8% | 13.4% |
Source: U.S. Census ACS 5-year estimates (2024)


