Waseca SnackAbility
Overall SnackAbility
Crime in Waseca summary. We use data from the FBI to determine the crime rates in Waseca. Key points include:
There were 128 total crimes in Waseca in the last reporting year.
The overall crime rate per 100,000 people in Waseca is 1,404.6 / 100k people.
The violent crime rate per 100,000 people in Waseca is 153.6 / 100k people.
The property crime rate per 100,000 people in Waseca is 1,251.0 / 100k people.
Overall, crime in Waseca is -33.72% below the national average.
Total Crimes
Below National Average
Crime In Waseca Comparison Table
| Statistic | Count Raw |
Waseca / 100k People |
Minnesota / 100k People |
National / 100k People |
|---|---|---|---|---|
| Total Crimes Per 100K | 128 | 1,404.6 | 1,862.9 | 2,119.2 |
| Violent Crime | 14 | 153.6 | 256.6 | 359.0 |
| Murder | 1 | 11.0 | 2.9 | 5.0 |
| Robbery | 1 | 11.0 | 48.9 | 61.0 |
| Aggravated Assault | 7 | 76.8 | 168.0 | 256.0 |
| Property Crime | 114 | 1,251.0 | 1,606.3 | 1,760.0 |
| Burglary | 11 | 120.7 | 184.7 | 229.0 |
| Larceny | 100 | 1,097.3 | 1,208.5 | 1,272.0 |
| Car Theft | 3 | 32.9 | 213.1 | 259.0 |
Source: FBI Uniform Crime Reporting (2024)
Cost of living in Waseca summary. We use data on the cost of living to determine how expensive it is to live in Waseca. Real estate prices drive most of the variance in cost of living around Minnesota. Key points include:
The cost of living in Waseca is 93 with 100 being average.
The cost of living in Waseca is 0.9x lower than the national average.
The median home value in Waseca is $241,936.
The median income in Waseca is $64,074.
Waseca's Overall Cost Of Living
Lower Than The National Average
Cost Of Living In Waseca Comparison Table
| Living Expense | Waseca | Minnesota | National Average |
|---|---|---|---|
| Overall | 93 | 101 | 100 |
| Services | 99 | 101 | 100 |
| Groceries | 102 | 99 | 100 |
| Health | 78 | 99 | 100 |
| Housing | 98 | 101 | 100 |
| Transportation | 108 | 103 | 100 |
| Utilities | 100 | 101 | 100 |
Source: Cost of living index, normalized to US average = 100
Waseca, MN Weather
The average high in Waseca is 54.8° and the average low is 35.1°.
There are 68.5 days of precipitation each year.
Expect an average of 33.0 inches of precipitation each year with 51.5 inches of snow.
| Stat | Waseca |
|---|---|
| Average Annual High | 54.8 |
| Average Annual Low | 35.1 |
| Annual Precipitation Days | 68.5 |
| Average Annual Precipitation | 33.0 |
| Average Annual Snowfall | 51.5 |
Average High
Days of Rain
Source: NOAA climate normals (30-year)
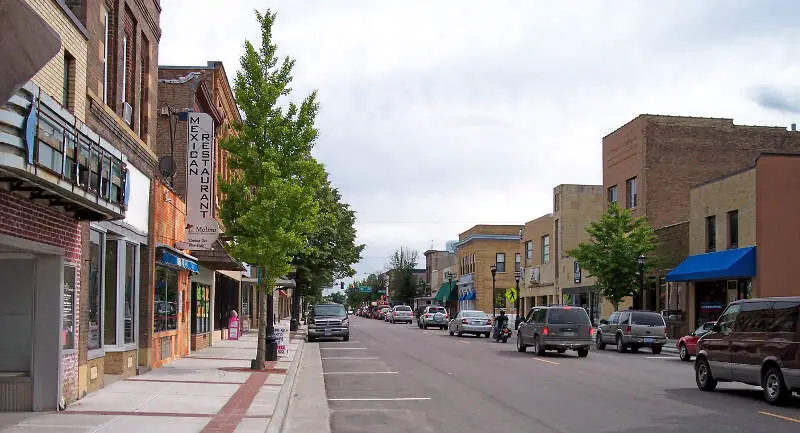
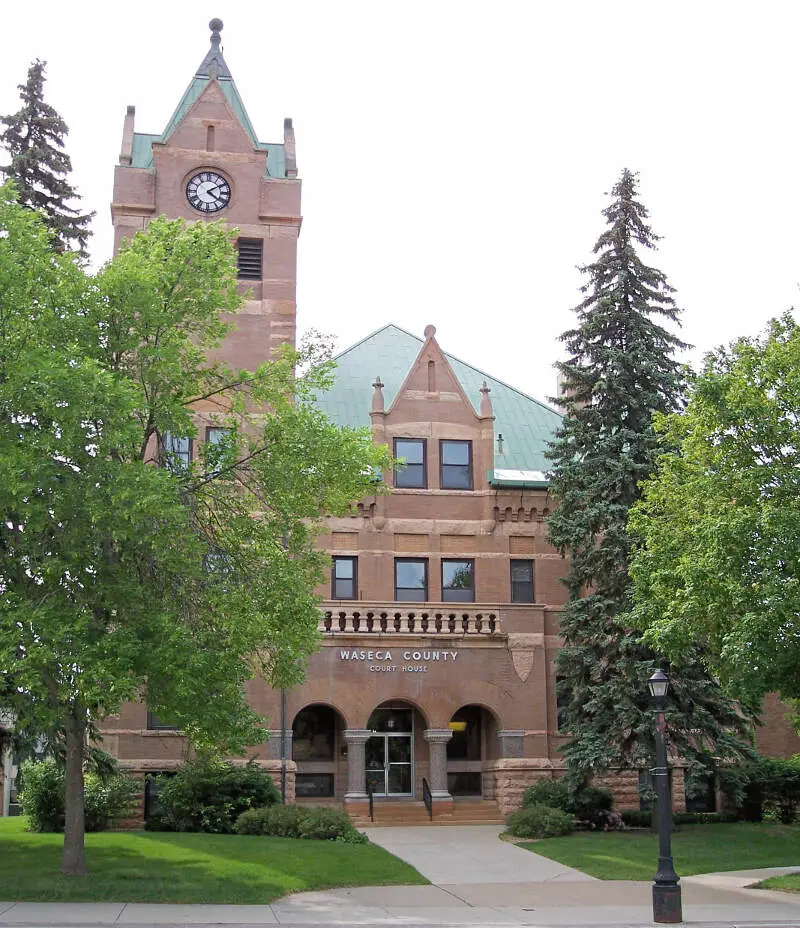
Waseca, MN Photos
Rankings & Articles For Waseca


Locations Around Waseca
Map Of Waseca, MN
Best Places Around Waseca
Lakeville, MN
Population 74,354
Apple Valley, MN
Population 55,679
North Mankato, MN
Population 14,211
Savage, MN
Population 32,889
Farmington, MN
Population 23,902
Prior Lake, MN
Population 28,016
St. Peter, MN
Population 12,185
Jordan, MN
Population 6,771
Burnsville, MN
Population 64,463
Shakopee, MN
Population 46,012
Waseca Demographics And Statistics
Population over time in Waseca
The current population in Waseca is 9,164. The population has decreased 2.8% from 2010.
| Year | Population | % Change |
|---|---|---|
| 2024 | 9,164 | -0.5% |
| 2023 | 9,209 | 0.0% |
| 2022 | 9,208 | -0.3% |
| 2021 | 9,237 | 3.9% |
| 2020 | 8,892 | -1.1% |
| 2019 | 8,988 | -0.8% |
| 2018 | 9,056 | -1.0% |
| 2017 | 9,151 | -1.3% |
| 2016 | 9,267 | -0.6% |
| 2015 | 9,324 | -0.5% |
| 2014 | 9,370 | 0.7% |
| 2013 | 9,301 | -0.4% |
| 2012 | 9,341 | -0.7% |
| 2011 | 9,405 | -0.2% |
| 2010 | 9,426 | - |
Race / Ethnicity in Waseca
See the full breakdown
Waseca is:
84.5% White with 7,746 White residents.
1.7% African American with 159 African American residents.
0.8% American Indian with 74 American Indian residents.
3.0% Asian with 274 Asian residents.
0.0% Hawaiian with 0 Hawaiian residents.
0.0% Other with 0 Other residents.
1.4% Two Or More with 124 Two Or More residents.
8.6% Hispanic with 787 Hispanic residents.
| Race | Waseca | MN | USA |
|---|---|---|---|
| White | 84.5% | 75.9% | 57.4% |
| African American | 1.7% | 6.9% | 11.9% |
| American Indian | 0.8% | 0.7% | 0.5% |
| Asian | 3.0% | 5.1% | 5.9% |
| Hawaiian | 0.0% | 0.0% | 0.2% |
| Other | 0.0% | 0.5% | 0.6% |
| Two Or More | 1.4% | 4.5% | 4.3% |
| Hispanic | 8.6% | 6.4% | 19.3% |
Gender in Waseca
See the full breakdown
Waseca is 55.1% female with 5,051 female residents.
Waseca is 44.9% male with 4,113 male residents.
| Gender | Waseca | MN | USA |
|---|---|---|---|
| Female | 55.1% | 49.9% | 50.5% |
| Male | 44.9% | 50.1% | 49.5% |
Highest level of educational attainment in Waseca for adults over 25
See the full breakdown
3.0% of adults in Waseca completed < 9th grade.
5.0% of adults in Waseca completed 9-12th grade.
39.0% of adults in Waseca completed high school / ged.
24.0% of adults in Waseca completed some college.
13.0% of adults in Waseca completed associate's degree.
13.0% of adults in Waseca completed bachelor's degree.
3.0% of adults in Waseca completed master's degree.
0.0% of adults in Waseca completed professional degree.
0.0% of adults in Waseca completed doctorate degree.
| Education | Waseca | MN | USA |
|---|---|---|---|
| < 9th Grade | 3.0% | 3.0% | 4.0% |
| 9-12th Grade | 5.0% | 3.0% | 6.0% |
| High School / GED | 39.0% | 23.0% | 26.0% |
| Some College | 24.0% | 19.0% | 19.0% |
| Associate's Degree | 13.0% | 12.0% | 9.0% |
| Bachelor's Degree | 13.0% | 26.0% | 22.0% |
| Master's Degree | 3.0% | 10.0% | 10.0% |
| Professional Degree | 0.0% | 2.0% | 2.0% |
| Doctorate Degree | 0.0% | 2.0% | 2.0% |
Household Income For Waseca, Minnesota
See the full breakdown
4.8% of households in Waseca earn Less than $10,000.
3.8% of households in Waseca earn $10,000 to $14,999.
9.5% of households in Waseca earn $15,000 to $24,999.
6.3% of households in Waseca earn $25,000 to $34,999.
16.6% of households in Waseca earn $35,000 to $49,999.
14.9% of households in Waseca earn $50,000 to $74,999.
15.1% of households in Waseca earn $75,000 to $99,999.
16.1% of households in Waseca earn $100,000 to $149,999.
11.0% of households in Waseca earn $150,000 to $199,999.
2.0% of households in Waseca earn $200,000 or more.
| Income | Waseca | MN | USA |
|---|---|---|---|
| Less than $10,000 | 4.8% | 3.8% | 5.0% |
| $10,000 to $14,999 | 3.8% | 2.7% | 3.4% |
| $15,000 to $24,999 | 9.5% | 5.2% | 6.3% |
| $25,000 to $34,999 | 6.3% | 5.6% | 6.6% |
| $35,000 to $49,999 | 16.6% | 9.3% | 10.1% |
| $50,000 to $74,999 | 14.9% | 15.6% | 15.5% |
| $75,000 to $99,999 | 15.1% | 13.2% | 12.6% |
| $100,000 to $149,999 | 16.1% | 19.6% | 17.5% |
| $150,000 to $199,999 | 11.0% | 11.2% | 9.6% |
| $200,000 or more | 2.0% | 13.8% | 13.4% |
Source: U.S. Census ACS 5-year estimates (2024)


