Bolivar SnackAbility
Overall SnackAbility
Crime in Bolivar summary. We use data from the FBI to determine the crime rates in Bolivar. Key points include:
There were 138 total crimes in Bolivar in the last reporting year.
The overall crime rate per 100,000 people in Bolivar is 1,197.6 / 100k people.
The violent crime rate per 100,000 people in Bolivar is 173.6 / 100k people.
The property crime rate per 100,000 people in Bolivar is 1,024.0 / 100k people.
Overall, crime in Bolivar is -43.49% below the national average.
Total Crimes
Below National Average
Crime In Bolivar Comparison Table
| Statistic | Count Raw |
Bolivar / 100k People |
Missouri / 100k People |
National / 100k People |
|---|---|---|---|---|
| Total Crimes Per 100K | 138 | 1,197.6 | 2,403.3 | 2,119.2 |
| Violent Crime | 20 | 173.6 | 462.0 | 359.0 |
| Murder | 0 | 0.0 | 7.8 | 5.0 |
| Robbery | 1 | 8.7 | 51.5 | 61.0 |
| Aggravated Assault | 8 | 69.4 | 357.5 | 256.0 |
| Property Crime | 118 | 1,024.0 | 1,941.2 | 1,760.0 |
| Burglary | 13 | 112.8 | 236.3 | 229.0 |
| Larceny | 97 | 841.8 | 1,306.5 | 1,272.0 |
| Car Theft | 8 | 69.4 | 398.4 | 259.0 |
Source: FBI Uniform Crime Reporting (2024)
Cost of living in Bolivar summary. We use data on the cost of living to determine how expensive it is to live in Bolivar. Real estate prices drive most of the variance in cost of living around Missouri. Key points include:
The cost of living in Bolivar is 91 with 100 being average.
The cost of living in Bolivar is 0.9x lower than the national average.
The median home value in Bolivar is $252,895.
The median income in Bolivar is $49,622.
Bolivar's Overall Cost Of Living
Lower Than The National Average
Cost Of Living In Bolivar Comparison Table
| Living Expense | Bolivar | Missouri | National Average |
|---|---|---|---|
| Overall | 91 | 90 | 100 |
| Services | 94 | 97 | 100 |
| Groceries | 94 | 98 | 100 |
| Health | 73 | 76 | 100 |
| Housing | 95 | 95 | 100 |
| Transportation | 97 | 94 | 100 |
| Utilities | 95 | 96 | 100 |
Source: Cost of living index, normalized to US average = 100
Bolivar, MO Weather
The average high in Bolivar is 66.9° and the average low is 44.6°.
There are 71.8 days of precipitation each year.
Expect an average of 46.4 inches of precipitation each year with 12.7 inches of snow.
| Stat | Bolivar |
|---|---|
| Average Annual High | 66.9 |
| Average Annual Low | 44.6 |
| Annual Precipitation Days | 71.8 |
| Average Annual Precipitation | 46.4 |
| Average Annual Snowfall | 12.7 |
Average High
Days of Rain
Source: NOAA climate normals (30-year)
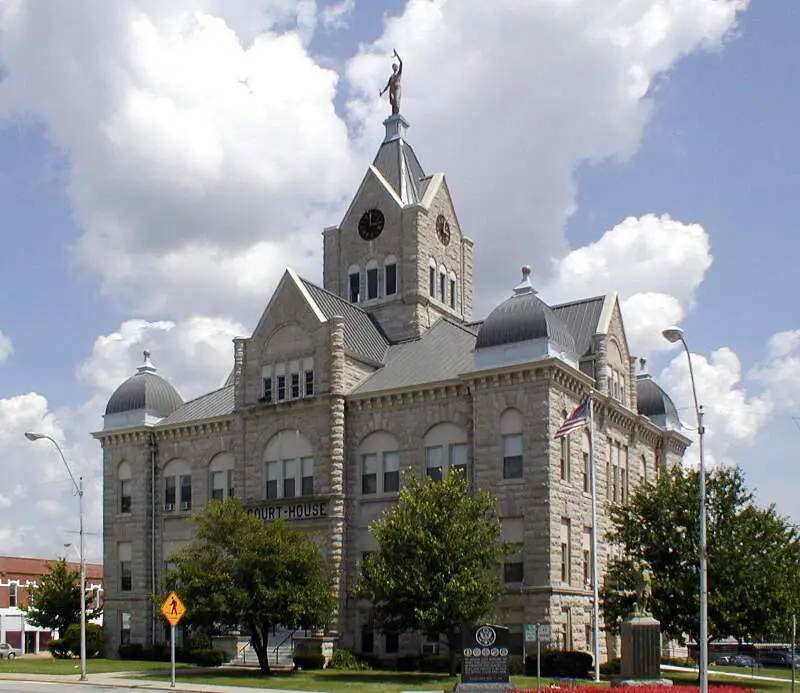
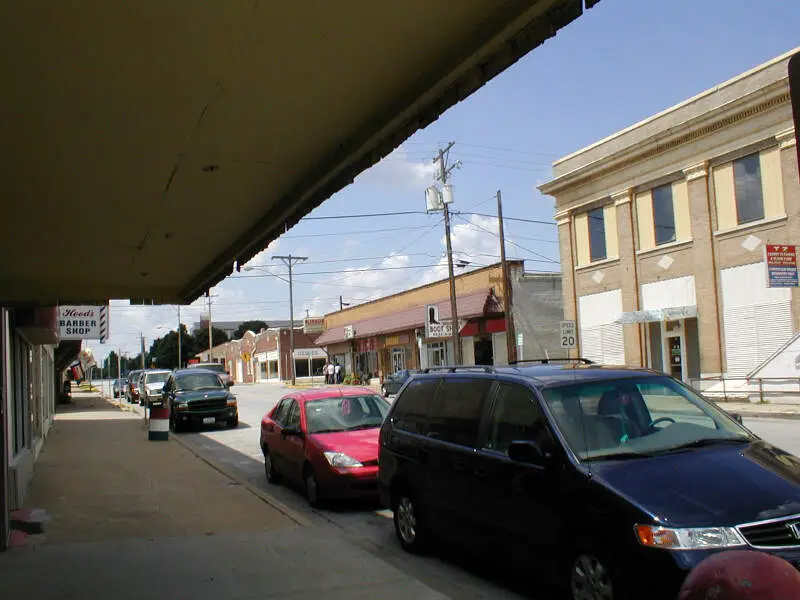
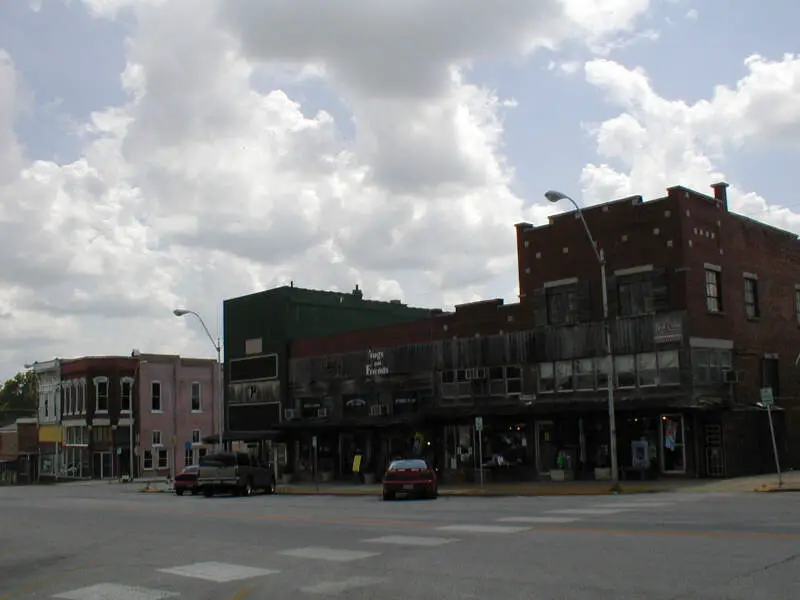
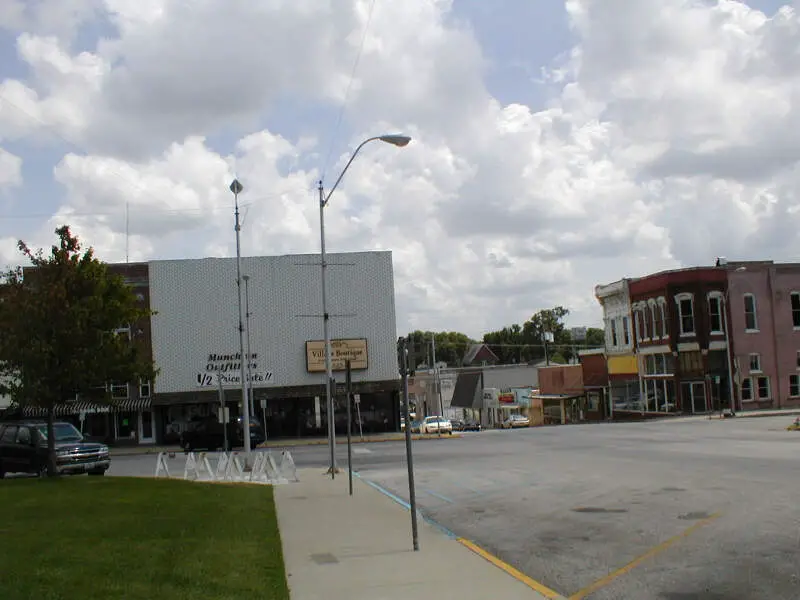
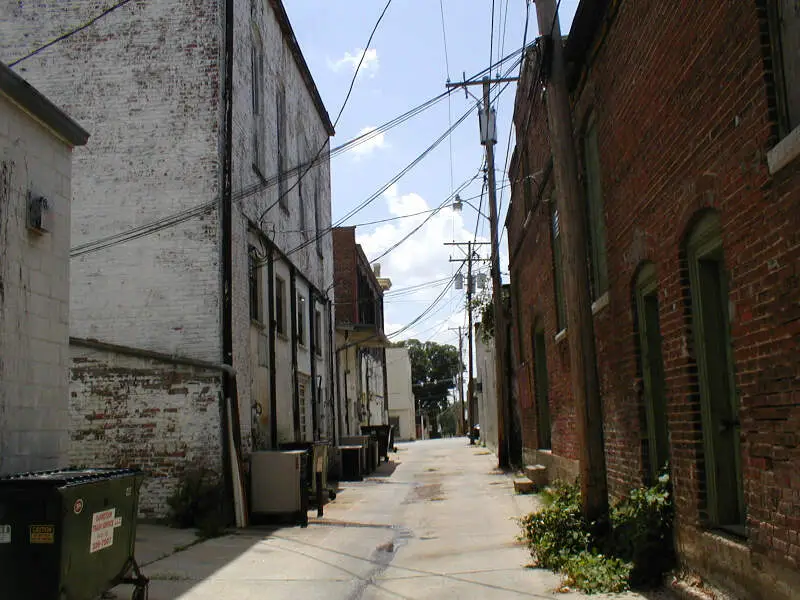
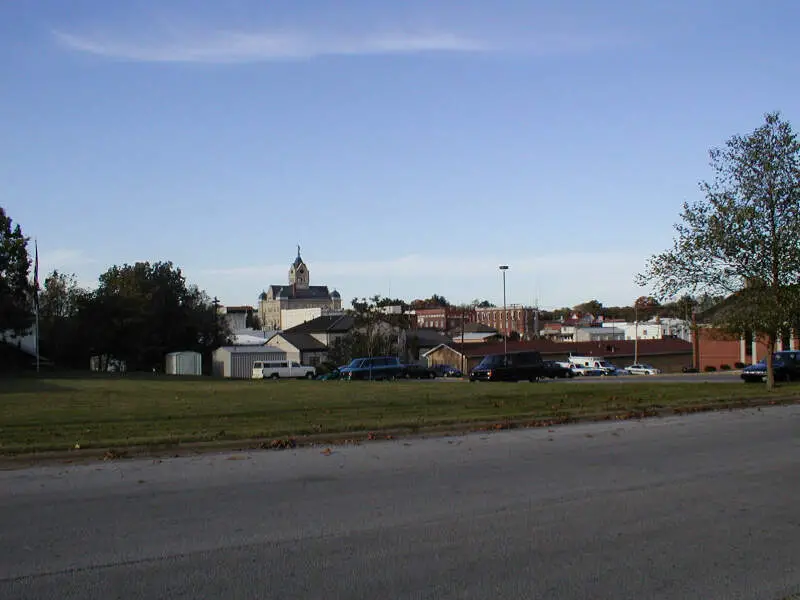
Bolivar, MO Photos
Rankings & Articles For Bolivar


Locations Around Bolivar
Map Of Bolivar, MO
Best Places Around Bolivar
Battlefield, MO
Population 6,165
Nixa, MO
Population 24,836
Willard, MO
Population 6,488
Ozark, MO
Population 22,417
Republic, MO
Population 19,829
Marshfield, MO
Population 7,696
Aurora, MO
Population 7,397
Springfield, MO
Population 169,954
Lebanon, MO
Population 15,270
Bolivar Demographics And Statistics
Population over time in Bolivar
The current population in Bolivar is 11,170. The population has increased 9.3% from 2010.
| Year | Population | % Change |
|---|---|---|
| 2024 | 11,170 | 1.6% |
| 2023 | 10,996 | 2.0% |
| 2022 | 10,780 | 0.6% |
| 2021 | 10,718 | -2.6% |
| 2020 | 11,000 | 1.1% |
| 2019 | 10,880 | 1.1% |
| 2018 | 10,760 | 1.0% |
| 2017 | 10,654 | 0.6% |
| 2016 | 10,592 | 0.8% |
| 2015 | 10,507 | 0.6% |
| 2014 | 10,443 | 0.4% |
| 2013 | 10,398 | 0.6% |
| 2012 | 10,331 | 0.4% |
| 2011 | 10,289 | 0.7% |
| 2010 | 10,222 | - |
Race / Ethnicity in Bolivar
See the full breakdown
Bolivar is:
91.4% White with 10,211 White residents.
0.9% African American with 97 African American residents.
0.2% American Indian with 20 American Indian residents.
0.4% Asian with 40 Asian residents.
0.0% Hawaiian with 0 Hawaiian residents.
0.3% Other with 30 Other residents.
3.3% Two Or More with 366 Two Or More residents.
3.6% Hispanic with 406 Hispanic residents.
| Race | Bolivar | MO | USA |
|---|---|---|---|
| White | 91.4% | 76.3% | 57.4% |
| African American | 0.9% | 10.9% | 11.9% |
| American Indian | 0.2% | 0.2% | 0.5% |
| Asian | 0.4% | 2.1% | 5.9% |
| Hawaiian | 0.0% | 0.1% | 0.2% |
| Other | 0.3% | 0.4% | 0.6% |
| Two Or More | 3.3% | 4.8% | 4.3% |
| Hispanic | 3.6% | 5.2% | 19.3% |
Gender in Bolivar
See the full breakdown
Bolivar is 54.2% female with 6,054 female residents.
Bolivar is 45.8% male with 5,116 male residents.
| Gender | Bolivar | MO | USA |
|---|---|---|---|
| Female | 54.2% | 50.7% | 50.5% |
| Male | 45.8% | 49.3% | 49.5% |
Highest level of educational attainment in Bolivar for adults over 25
See the full breakdown
3.0% of adults in Bolivar completed < 9th grade.
8.0% of adults in Bolivar completed 9-12th grade.
32.0% of adults in Bolivar completed high school / ged.
20.0% of adults in Bolivar completed some college.
10.0% of adults in Bolivar completed associate's degree.
16.0% of adults in Bolivar completed bachelor's degree.
7.0% of adults in Bolivar completed master's degree.
1.0% of adults in Bolivar completed professional degree.
3.0% of adults in Bolivar completed doctorate degree.
| Education | Bolivar | MO | USA |
|---|---|---|---|
| < 9th Grade | 3.0% | 4.0% | 4.0% |
| 9-12th Grade | 8.0% | 5.0% | 6.0% |
| High School / GED | 32.0% | 30.0% | 26.0% |
| Some College | 20.0% | 21.0% | 19.0% |
| Associate's Degree | 10.0% | 8.0% | 9.0% |
| Bachelor's Degree | 16.0% | 20.0% | 22.0% |
| Master's Degree | 7.0% | 9.0% | 10.0% |
| Professional Degree | 1.0% | 2.0% | 2.0% |
| Doctorate Degree | 3.0% | 1.0% | 2.0% |
Household Income For Bolivar, Missouri
See the full breakdown
2.7% of households in Bolivar earn Less than $10,000.
7.5% of households in Bolivar earn $10,000 to $14,999.
15.1% of households in Bolivar earn $15,000 to $24,999.
10.7% of households in Bolivar earn $25,000 to $34,999.
14.3% of households in Bolivar earn $35,000 to $49,999.
15.8% of households in Bolivar earn $50,000 to $74,999.
9.8% of households in Bolivar earn $75,000 to $99,999.
15.0% of households in Bolivar earn $100,000 to $149,999.
5.2% of households in Bolivar earn $150,000 to $199,999.
3.7% of households in Bolivar earn $200,000 or more.
| Income | Bolivar | MO | USA |
|---|---|---|---|
| Less than $10,000 | 2.7% | 4.9% | 5.0% |
| $10,000 to $14,999 | 7.5% | 3.8% | 3.4% |
| $15,000 to $24,999 | 15.1% | 7.1% | 6.3% |
| $25,000 to $34,999 | 10.7% | 7.8% | 6.6% |
| $35,000 to $49,999 | 14.3% | 11.9% | 10.1% |
| $50,000 to $74,999 | 15.8% | 17.4% | 15.5% |
| $75,000 to $99,999 | 9.8% | 13.2% | 12.6% |
| $100,000 to $149,999 | 15.0% | 17.1% | 17.5% |
| $150,000 to $199,999 | 5.2% | 8.2% | 9.6% |
| $200,000 or more | 3.7% | 8.7% | 13.4% |
Source: U.S. Census ACS 5-year estimates (2024)


