We all love the biggest cities that the Show Me State has to offer. You know the places like Kansas City and St. Louis which make all the headlines.
But there are a bunch of other great large cities in Missouri that don't get as much love.
We're going to change that right now.
Using the most recent Census data, we can tell you about all the places in Missouri with a focus on the biggest. We update the data each year and this is our fourth time doing this.
The Largest Cities In Missouri For 2026:
You can click here to see a full table of the 100 biggest cities in Missouri, along with every other place over 1,000 people big. It is sortable by clicking on the headers.
Read on below to see more on the biggest cities. Or for more reading on places to live in Missouri, check out:
- Best Places To Live In Missouri
- Cheapest Places To Live In Missouri
- Most Dangerous Cities in Missouri
The 10 Biggest Cities In Missouri

/10
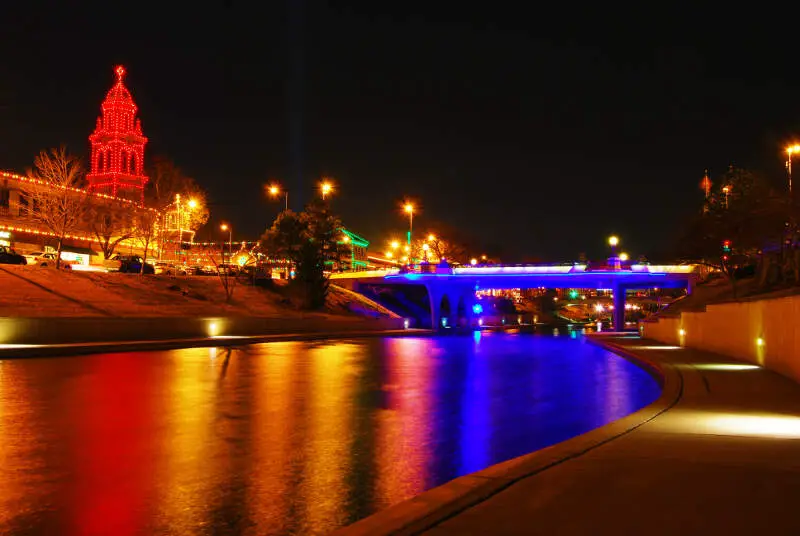
Rank Last Year: 1 (No Change)
Population: 510,612.0
Population 2010: 454,876
Growth: 12.3%
More on Kansas City: Data | Crime | Cost Of Living | Real Estate

/10
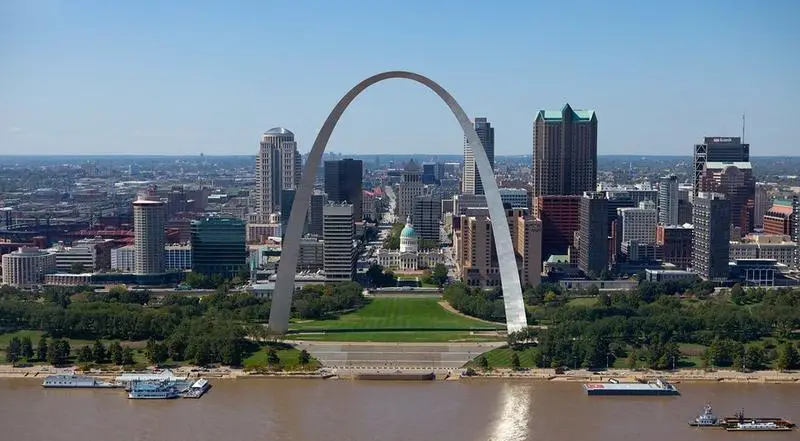
Rank Last Year: 2 (No Change)
Population: 288,512.0
Population 2010: 318,809
Growth: -9.5%
More on St. Louis: Data | Crime | Cost Of Living | Real Estate

/10
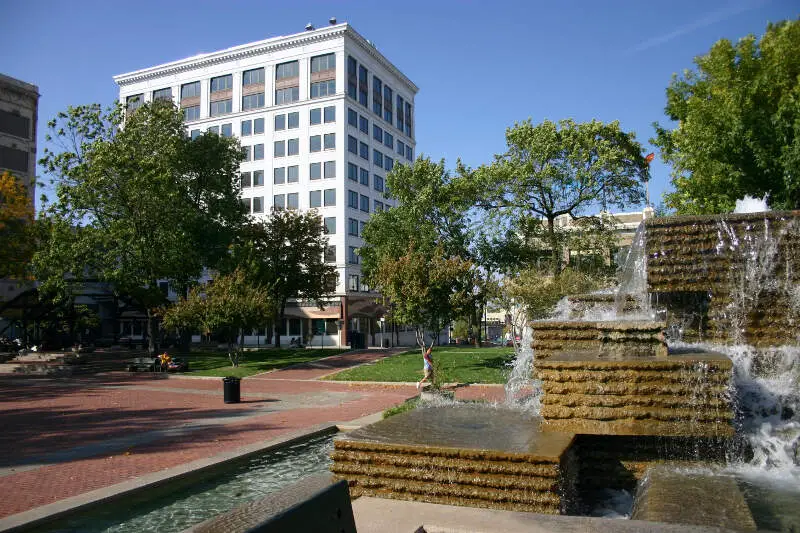
Rank Last Year: 3 (No Change)
Population: 169,954.0
Population 2010: 158,945
Growth: 6.9%
More on Springfield: Data | Crime | Cost Of Living | Real Estate

/10
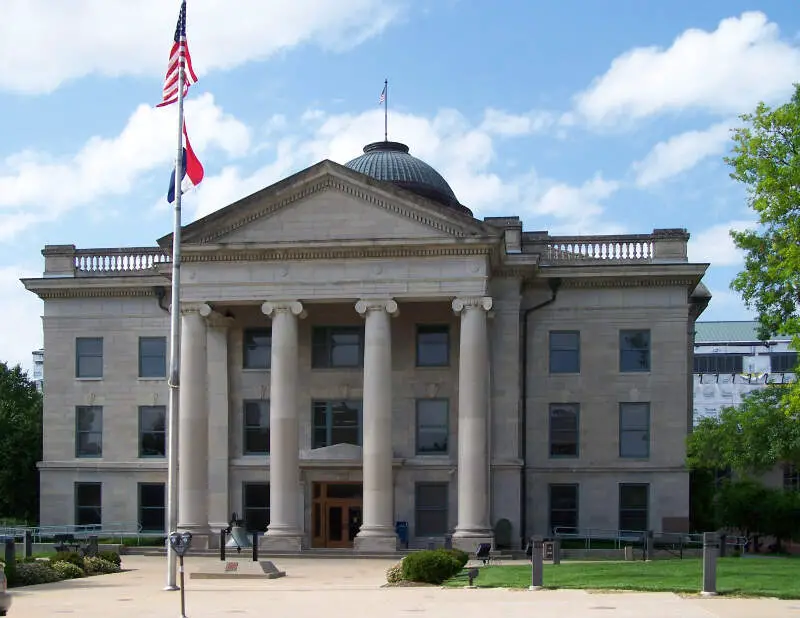
Rank Last Year: 4 (No Change)
Population: 128,548.0
Population 2010: 104,620
Growth: 22.9%
More on Columbia: Data | Crime | Cost Of Living | Real Estate

/10
Rank Last Year: 5 (No Change)
Population: 121,740.0
Population 2010: 115,578
Growth: 5.3%
More on Independence: Data | Crime | Cost Of Living | Real Estate
/10
Rank Last Year: 6 (No Change)
Population: 103,656.0
Population 2010: 87,027
Growth: 19.1%
More on Lee's Summit: Data | Crime | Cost Of Living | Real Estate
/10
Rank Last Year: 7 (No Change)
Population: 93,801.0
Population 2010: 74,777
Growth: 25.4%
More on O'fallon: Data | Crime | Cost Of Living | Real Estate

/10
Rank Last Year: 9 (Up 1)
Population: 71,508.0
Population 2010: 65,374
Growth: 9.4%
More on St. Charles: Data | Crime | Cost Of Living | Real Estate

/10
Rank Last Year: 8 (Down 1)
Population: 71,236.0
Population 2010: 75,911
Growth: -6.2%
More on St. Joseph: Data | Crime | Cost Of Living | Real Estate

/10
Rank Last Year: 10 (No Change)
Population: 59,965.0
Population 2010: 51,508
Growth: 16.4%
More on Blue Springs: Data | Crime | Cost Of Living | Real Estate
How We Determined The Largest Cities In Missouri
We've been ranking and dissecting cities in the Show Me State for over 4 years now -- making this actually the fourth time we've run the numbers. We always use the best data, the US Census. In this case, that means we are using the American Community Survey.
It what is probably the most simple analysis we run each year, we ranked every place in Missouri from biggest to smallest. The biggest city this year? That would be Kansas City.
The smallest? Gainesville, although there are places smaller than 1,000 people not listed here, so keep that in mind as we take a look at the top ten.
Now on to numbers 11-100 Biggest in Missouri
We hope that you find the big city, or really any city, that's right for you. Below is a list of the rest of the biggest cities along with every other place in Missouri.
Have fun snacking around in the Show Me State!
For more reading on Missouri, check out:
- Best Places To Raise A Family In Missouri
- Best Places To Retire In Missouri
- Richest Cities In Missouri
- Safest Places In Missouri
- Worst Places To Live In Missouri
- Most Expensive Places To Live In Missouri
Detailed List Of The Biggest Cities In Missouri
| Rank | City | Current Population | 2010 | Growth |
|---|---|---|---|---|
| 1 | Kansas City | 510,612.0 | 454,876 | 12.3% |
| 2 | St. Louis | 288,512.0 | 318,809 | -9.5% |
| 3 | Springfield | 169,954.0 | 158,945 | 6.9% |
| 4 | Columbia | 128,548.0 | 104,620 | 22.9% |
| 5 | Independence | 121,740.0 | 115,578 | 5.3% |
| 6 | Lee's Summit | 103,656.0 | 87,027 | 19.1% |
| 7 | O'fallon | 93,801.0 | 74,777 | 25.4% |
| 8 | St. Charles | 71,508.0 | 65,374 | 9.4% |
| 9 | St. Joseph | 71,236.0 | 75,911 | -6.2% |
| 10 | Blue Springs | 59,965.0 | 51,508 | 16.4% |
| 11 | St. Peters | 59,092.0 | 52,850 | 11.8% |
| 12 | Joplin | 52,593.0 | 49,453 | 6.3% |
| 13 | Florissant | 51,773.0 | 52,462 | -1.3% |
| 14 | Chesterfield | 49,574.0 | 47,253 | 4.9% |
| 15 | Wentzville | 47,061.0 | 25,386 | 85.4% |
| 16 | Jefferson City | 42,488.0 | 42,374 | 0.3% |
| 17 | Cape Girardeau | 40,344.0 | 37,410 | 7.8% |
| 18 | Oakville | 35,333.0 | 35,253 | 0.2% |
| 19 | Wildwood | 35,133.0 | 34,970 | 0.5% |
| 20 | University City | 34,685.0 | 35,704 | -2.9% |
| 21 | Ballwin | 31,279.0 | 30,496 | 2.6% |
| 22 | Liberty | 30,689.0 | 28,645 | 7.1% |
| 23 | Mehlville | 29,805.0 | 27,364 | 8.9% |
| 24 | Raytown | 29,445.0 | 29,490 | -0.2% |
| 25 | Kirkwood | 29,363.0 | 27,412 | 7.1% |
| 26 | Maryland Heights | 27,880.0 | 27,377 | 1.8% |
| 27 | Gladstone | 27,207.0 | 25,501 | 6.7% |
| 28 | Grandview | 26,527.0 | 24,420 | 8.6% |
| 29 | Hazelwood | 25,114.0 | 25,716 | -2.3% |
| 30 | Belton | 25,008.0 | 23,092 | 8.3% |
| 31 | Nixa | 24,836.0 | 18,021 | 37.8% |
| 32 | Raymore | 24,526.0 | 18,009 | 36.2% |
| 33 | Webster Groves | 23,712.0 | 22,984 | 3.2% |
| 34 | Ozark | 22,417.0 | 16,622 | 34.9% |
| 35 | Sedalia | 22,003.0 | 21,142 | 4.1% |
| 36 | Arnold | 20,956.0 | 20,753 | 1.0% |
| 37 | Old Jamestown | 20,651.0 | 20,509 | 0.7% |
| 38 | Rolla | 20,287.0 | 19,141 | 6.0% |
| 39 | Republic | 19,829.0 | 13,772 | 44.0% |
| 40 | Warrensburg | 19,582.0 | 18,465 | 6.0% |
| 41 | Affton | 19,052.0 | 20,115 | -5.3% |
| 42 | Creve Coeur | 18,643.0 | 17,581 | 6.0% |
| 43 | Concord | 18,368.0 | 15,840 | 16.0% |
| 44 | Farmington | 18,282.0 | 16,143 | 13.3% |
| 45 | Ferguson | 18,213.0 | 21,339 | -14.6% |
| 46 | Manchester | 18,160.0 | 18,215 | -0.3% |
| 47 | Lake St. Louis | 18,066.0 | 13,900 | 30.0% |
| 48 | Spanish Lake | 17,873.0 | 21,803 | -18.0% |
| 49 | Kirksville | 17,563.0 | 17,413 | 0.9% |
| 50 | Clayton | 17,380.0 | 15,337 | 13.3% |
| 51 | Hannibal | 16,771.0 | 17,821 | -5.9% |
| 52 | Sikeston | 16,320.0 | 16,369 | -0.3% |
| 53 | Grain Valley | 16,271.0 | 11,428 | 42.4% |
| 54 | Poplar Bluff | 16,254.0 | 17,123 | -5.1% |
| 55 | Lemay | 16,228.0 | 15,924 | 1.9% |
| 56 | Overland | 15,695.0 | 16,163 | -2.9% |
| 57 | Jackson | 15,659.0 | 13,419 | 16.7% |
| 58 | Carthage | 15,574.0 | 14,114 | 10.3% |
| 59 | Fort Leonard Wood | 15,432.0 | 15,235 | 1.3% |
| 60 | Lebanon | 15,270.0 | 14,211 | 7.5% |
| 61 | Washington | 15,130.0 | 13,968 | 8.3% |
| 62 | Troy | 13,947.0 | 10,103 | 38.0% |
| 63 | Marshall | 13,739.0 | 12,823 | 7.1% |
| 64 | Moberly | 13,526.0 | 14,057 | -3.8% |
| 65 | Dardenne Prairie | 13,503.0 | 10,290 | 31.2% |
| 66 | Neosho | 13,224.0 | 11,719 | 12.8% |
| 67 | Webb City | 13,221.0 | 10,765 | 22.8% |
| 68 | Festus | 13,201.0 | 11,309 | 16.7% |
| 69 | Eureka | 13,081.0 | 9,707 | 34.8% |
| 70 | Jennings | 12,918.0 | 14,826 | -12.9% |
| 71 | Branson | 12,817.0 | 9,854 | 30.1% |
| 72 | St. Ann | 12,811.0 | 13,071 | -2.0% |
| 73 | Union | 12,781.0 | 9,820 | 30.2% |
| 74 | Fulton | 12,617.0 | 12,618 | -0.0% |
| 75 | West Plains | 12,441.0 | 11,759 | 5.8% |
| 76 | Crestwood | 12,295.0 | 11,892 | 3.4% |
| 77 | Town And Country | 11,607.0 | 10,812 | 7.4% |
| 78 | Mexico | 11,477.0 | 11,559 | -0.7% |
| 79 | Bridgeton | 11,369.0 | 12,234 | -7.1% |
| 80 | Bolivar | 11,170.0 | 10,222 | 9.3% |
| 81 | Kearney | 10,885.0 | 7,864 | 38.4% |
| 82 | Smithville | 10,705.0 | 7,896 | 35.6% |
| 83 | Bellefontaine Neighbors | 10,498.0 | 10,918 | -3.8% |
| 84 | Excelsior Springs | 10,484.0 | 11,118 | -5.7% |
| 85 | Maryville | 10,428.0 | 11,695 | -10.8% |
| 86 | Kennett | 10,196.0 | 11,269 | -9.5% |
| 87 | Ellisville | 10,002.0 | 9,102 | 9.9% |
| 88 | Harrisonville | 9,970.0 | 9,973 | -0.0% |
| 89 | Monett | 9,873.0 | 8,799 | 12.2% |
| 90 | Des Peres | 9,170.0 | 8,397 | 9.2% |
| 91 | Richmond Heights | 9,153.0 | 8,767 | 4.4% |
| 92 | Sunset Hills | 9,112.0 | 8,424 | 8.2% |
| 93 | Warrenton | 9,066.0 | 7,586 | 19.5% |
| 94 | Clinton | 9,065.0 | 9,248 | -2.0% |
| 95 | Ladue | 8,940.0 | 8,467 | 5.6% |
| 96 | Chillicothe | 8,923.0 | 8,867 | 0.6% |
| 97 | Pleasant Hill | 8,847.0 | 7,769 | 13.9% |
| 98 | Park Hills | 8,678.0 | 8,626 | 0.6% |
| 99 | Olivette | 8,645.0 | 7,660 | 12.9% |
| 100 | Oak Grove | 8,538.0 | 7,400 | 15.4% |
| 101 | Perryville | 8,536.0 | 8,176 | 4.4% |
| 102 | Cameron | 8,519.0 | 9,730 | -12.4% |
| 103 | Parkville | 8,366.0 | 5,311 | 57.5% |
| 104 | Carl Junction | 8,339.0 | 7,081 | 17.8% |
| 105 | Murphy | 8,285.0 | 8,911 | -7.0% |
| 106 | Maplewood | 8,156.0 | 8,227 | -0.9% |
| 107 | Brentwood | 8,144.0 | 7,973 | 2.1% |
| 108 | Berkeley | 8,123.0 | 9,141 | -11.1% |
| 109 | Nevada | 7,925.0 | 8,164 | -2.9% |
| 110 | Dexter | 7,891.0 | 7,855 | 0.5% |
| 111 | Marshfield | 7,696.0 | 6,554 | 17.4% |
| 112 | Boonville | 7,689.0 | 8,391 | -8.4% |
| 113 | Pacific | 7,475.0 | 6,414 | 16.5% |
| 114 | Aurora | 7,397.0 | 7,505 | -1.4% |
| 115 | Sappington | 7,367.0 | 7,982 | -7.7% |
| 116 | Valley Park | 6,795.0 | 6,864 | -1.0% |
| 117 | Bonne Terre | 6,683.0 | 6,529 | 2.4% |
| 118 | Black Jack | 6,589.0 | 6,888 | -4.3% |
| 119 | St. John | 6,527.0 | 6,563 | -0.5% |
| 120 | Willard | 6,488.0 | 4,960 | 30.8% |
| 121 | De Soto | 6,470.0 | 6,447 | 0.4% |
| 122 | Shrewsbury | 6,316.0 | 6,293 | 0.4% |
| 123 | Sullivan | 6,310.0 | 7,310 | -13.7% |
| 124 | Battlefield | 6,165.0 | 5,044 | 22.2% |
| 125 | Glendale | 6,114.0 | 5,880 | 4.0% |
| 126 | Pevely | 6,055.0 | 5,206 | 16.3% |
| 127 | Greenwood | 6,013.0 | 4,963 | 21.2% |
| 128 | Richmond | 5,959.0 | 5,907 | 0.9% |
| 129 | Peculiar | 5,958.0 | 4,325 | 37.8% |
| 130 | Cottleville | 5,937.0 | 2,914 | 103.7% |
| 131 | Barnhart | 5,785.0 | 5,864 | -1.3% |
| 132 | Odessa | 5,620.0 | 5,211 | 7.8% |
| 133 | Trenton | 5,536.0 | 6,018 | -8.0% |
| 134 | Glasgow Village | 5,504.0 | 5,155 | 6.8% |
| 135 | Imperial | 5,488.0 | 4,445 | 23.5% |
| 136 | Macon | 5,466.0 | 5,462 | 0.1% |
| 137 | Waynesville | 5,442.0 | 4,440 | 22.6% |
| 138 | St. Robert | 5,356.0 | 3,929 | 36.3% |
| 139 | Caruthersville | 5,326.0 | 6,279 | -15.2% |
| 140 | Weldon Spring | 5,310.0 | 5,463 | -2.8% |
| 141 | Wright City | 5,240.0 | 2,931 | 78.8% |
| 142 | Herculaneum | 5,071.0 | 3,364 | 50.7% |
| 143 | Savannah | 5,053.0 | 4,967 | 1.7% |
| 144 | Ste. Genevieve | 5,010.0 | 4,448 | 12.6% |
| 145 | North Kansas City | 4,983.0 | 4,295 | 16.0% |
| 146 | Ashland | 4,914.0 | 3,454 | 42.3% |
| 147 | Rogersville | 4,908.0 | 2,935 | 67.2% |
| 148 | Osage Beach | 4,905.0 | 4,360 | 12.5% |
| 149 | Desloge | 4,863.0 | 5,046 | -3.6% |
| 150 | Dellwood | 4,847.0 | 5,044 | -3.9% |
| 151 | Platte City | 4,824.0 | 4,526 | 6.6% |
| 152 | St. Clair | 4,789.0 | 4,704 | 1.8% |
| 153 | Higginsville | 4,781.0 | 4,810 | -0.6% |
| 154 | Crystal City | 4,718.0 | 4,780 | -1.3% |
| 155 | Rock Hill | 4,693.0 | 4,649 | 0.9% |
| 156 | Centralia | 4,690.0 | 3,997 | 17.3% |
| 157 | Salem | 4,677.0 | 4,973 | -6.0% |
| 158 | Butler | 4,668.0 | 4,266 | 9.4% |
| 159 | Hollister | 4,643.0 | 4,321 | 7.5% |
| 160 | Holts Summit | 4,609.0 | 3,193 | 44.3% |
| 161 | Lexington | 4,606.0 | 4,758 | -3.2% |
| 162 | Mount Vernon | 4,563.0 | 4,535 | 0.6% |
| 163 | Eldon | 4,556.0 | 4,685 | -2.8% |
| 164 | California | 4,509.0 | 4,238 | 6.4% |
| 165 | Fredericktown | 4,507.0 | 4,006 | 12.5% |
| 166 | Mountain Grove | 4,491.0 | 4,822 | -6.9% |
| 167 | Charleston | 4,482.0 | 5,720 | -21.6% |
| 168 | Breckenridge Hills | 4,402.0 | 4,748 | -7.3% |
| 169 | Scott City | 4,371.0 | 4,574 | -4.4% |
| 170 | Lamar | 4,284.0 | 4,599 | -6.8% |
| 171 | Riverside | 4,276.0 | 2,949 | 45.0% |
| 172 | Normandy | 4,239.0 | 5,058 | -16.2% |
| 173 | Bowling Green | 4,170.0 | 4,988 | -16.4% |
| 174 | Brookfield | 4,144.0 | 4,468 | -7.3% |
| 175 | Fenton | 4,088.0 | 4,042 | 1.1% |
| 176 | Camdenton | 4,023.0 | 3,681 | 9.3% |
| 177 | St. James | 3,916.0 | 4,169 | -6.1% |
| 178 | Woodson Terrace | 3,908.0 | 4,085 | -4.3% |
| 179 | Moscow Mills | 3,823.0 | 2,451 | 56.0% |
| 180 | Malden | 3,805.0 | 4,064 | -6.4% |
| 181 | High Ridge | 3,714.0 | 4,808 | -22.8% |
| 182 | Frontenac | 3,701.0 | 3,465 | 6.8% |
| 183 | Palmyra | 3,623.0 | 3,565 | 1.6% |
| 184 | Northwoods | 3,623.0 | 4,286 | -15.5% |
| 185 | El Dorado Springs | 3,586.0 | 3,686 | -2.7% |
| 186 | Whiteman Afb | 3,517.0 | 3,347 | 5.1% |
| 187 | Hillsboro | 3,500.0 | 2,641 | 32.5% |
| 188 | St. Paul | 3,456.0 | 2,001 | 72.7% |
| 189 | Buffalo | 3,417.0 | 3,178 | 7.5% |
| 190 | New Haven | 3,302.0 | 2,313 | 42.8% |
| 191 | Sugar Creek | 3,249.0 | 3,381 | -3.9% |
| 192 | Louisiana | 3,228.0 | 3,471 | -7.0% |
| 193 | Cassville | 3,202.0 | 3,309 | -3.2% |
| 194 | Cuba | 3,189.0 | 3,372 | -5.4% |
| 195 | Byrnes Mill | 3,189.0 | 2,733 | 16.7% |
| 196 | Carrollton | 3,145.0 | 3,802 | -17.3% |
| 197 | Vandalia | 3,140.0 | 3,932 | -20.1% |
| 198 | Windsor | 3,094.0 | 2,967 | 4.3% |
| 199 | Bethany | 3,080.0 | 3,196 | -3.6% |
| 200 | Ava | 3,045.0 | 3,058 | -0.4% |
| 201 | Clever | 3,030.0 | 1,647 | 84.0% |
| 202 | Monroe City | 3,028.0 | 2,659 | 13.9% |
| 203 | Chaffee | 3,026.0 | 2,968 | 2.0% |
| 204 | Gray Summit | 2,991.0 | 2,582 | 15.8% |
| 205 | Country Club | 2,935.0 | 2,221 | 32.1% |
| 206 | Buckner | 2,914.0 | 2,979 | -2.2% |
| 207 | Piedmont | 2,911.0 | 2,013 | 44.6% |
| 208 | Lawson | 2,905.0 | 2,621 | 10.8% |
| 209 | East Prairie | 2,902.0 | 3,188 | -9.0% |
| 210 | Licking | 2,858.0 | 3,521 | -18.8% |
| 211 | Moline Acres | 2,843.0 | 2,709 | 4.9% |
| 212 | Knob Noster | 2,838.0 | 2,740 | 3.6% |
| 213 | Villa Ridge | 2,835.0 | 2,462 | 15.2% |
| 214 | Portageville | 2,825.0 | 3,199 | -11.7% |
| 215 | Owensville | 2,806.0 | 2,681 | 4.7% |
| 216 | Oronogo | 2,804.0 | 2,430 | 15.4% |
| 217 | Montgomery City | 2,801.0 | 2,766 | 1.3% |
| 218 | Fayette | 2,801.0 | 2,698 | 3.8% |
| 219 | Marionville | 2,785.0 | 2,373 | 17.4% |
| 220 | Forsyth | 2,766.0 | 1,978 | 39.8% |
| 221 | Canton | 2,752.0 | 2,915 | -5.6% |
| 222 | Granby | 2,745.0 | 2,320 | 18.3% |
| 223 | Pleasant Valley | 2,736.0 | 3,001 | -8.8% |
| 224 | Riverview | 2,731.0 | 2,872 | -4.9% |
| 225 | Pine Lawn | 2,716.0 | 3,432 | -20.9% |
| 226 | Green Park | 2,690.0 | 2,621 | 2.6% |
| 227 | Anderson | 2,685.0 | 2,705 | -0.7% |
| 228 | Strafford | 2,672.0 | 1,879 | 42.2% |
| 229 | Tipton | 2,667.0 | 3,263 | -18.3% |
| 230 | New Madrid | 2,662.0 | 3,109 | -14.4% |
| 231 | Mountain View | 2,658.0 | 2,681 | -0.9% |
| 232 | Versailles | 2,610.0 | 2,160 | 20.8% |
| 233 | Clarkson Valley | 2,584.0 | 2,623 | -1.5% |
| 234 | Lathrop | 2,560.0 | 2,395 | 6.9% |
| 235 | Potosi | 2,544.0 | 2,767 | -8.1% |
| 236 | Pagedale | 2,531.0 | 3,327 | -23.9% |
| 237 | Terre Du Lac | 2,516.0 | 2,176 | 15.6% |
| 238 | Kimberling City | 2,476.0 | 2,651 | -6.6% |
| 239 | Lake Lotawana | 2,442.0 | 2,144 | 13.9% |
| 240 | Bel-Ridge | 2,432.0 | 2,799 | -13.1% |
| 241 | Weatherby Lake | 2,401.0 | 1,969 | 21.9% |
| 242 | Warson Woods | 2,393.0 | 1,877 | 27.5% |
| 243 | Cabool | 2,348.0 | 2,442 | -3.8% |
| 244 | Doniphan | 2,345.0 | 2,289 | 2.4% |
| 245 | Castle Point | 2,340.0 | 3,623 | -35.4% |
| 246 | Lake Ozark | 2,335.0 | 1,214 | 92.3% |
| 247 | Thayer | 2,333.0 | 2,567 | -9.1% |
| 248 | Concordia | 2,332.0 | 2,405 | -3.0% |
| 249 | Sparta | 2,331.0 | 1,747 | 33.4% |
| 250 | Marthasville | 2,328.0 | 1,125 | 106.9% |
| 251 | Marceline | 2,292.0 | 2,302 | -0.4% |
| 252 | Hermann | 2,290.0 | 2,458 | -6.8% |
| 253 | Willow Springs | 2,279.0 | 2,467 | -7.6% |
| 254 | Duquesne | 2,257.0 | 1,585 | 42.4% |
| 255 | Plattsburg | 2,253.0 | 2,345 | -3.9% |
| 256 | Village Of Four Seasons | 2,252.0 | 1,663 | 35.4% |
| 257 | Houston | 2,226.0 | 2,110 | 5.5% |
| 258 | Seymour | 2,179.0 | 1,595 | 36.6% |
| 259 | Hanley Hills | 2,178.0 | 2,006 | 8.6% |
| 260 | Marlborough | 2,157.0 | 1,864 | 15.7% |
| 261 | Richland | 2,136.0 | 1,728 | 23.6% |
| 262 | Hayti | 2,090.0 | 2,966 | -29.5% |
| 263 | Carterville | 2,074.0 | 1,687 | 22.9% |
| 264 | Kahoka | 2,072.0 | 2,357 | -12.1% |
| 265 | Bloomfield | 2,069.0 | 1,923 | 7.6% |
| 266 | Slater | 2,066.0 | 2,124 | -2.7% |
| 267 | Vinita Park | 2,042.0 | 1,670 | 22.3% |
| 268 | Holden | 1,989.0 | 2,362 | -15.8% |
| 269 | Warsaw | 1,980.0 | 2,376 | -16.7% |
| 270 | Stockton | 1,950.0 | 1,761 | 10.7% |
| 271 | Winchester | 1,939.0 | 1,388 | 39.7% |
| 272 | Hallsville | 1,927.0 | 1,791 | 7.6% |
| 273 | Weston | 1,922.0 | 1,717 | 11.9% |
| 274 | Duenweg | 1,918.0 | 1,062 | 80.6% |
| 275 | Noel | 1,913.0 | 2,506 | -23.7% |
| 276 | Albany | 1,909.0 | 1,936 | -1.4% |
| 277 | Seneca | 1,906.0 | 2,029 | -6.1% |
| 278 | Elsberry | 1,870.0 | 1,985 | -5.8% |
| 279 | Milan | 1,859.0 | 2,094 | -11.2% |
| 280 | Adrian | 1,857.0 | 1,928 | -3.7% |
| 281 | Unionville | 1,824.0 | 1,648 | 10.7% |
| 282 | Claycomo | 1,820.0 | 1,370 | 32.8% |
| 283 | Gower | 1,799.0 | 1,580 | 13.9% |
| 284 | Lincoln | 1,787.0 | 1,511 | 18.3% |
| 285 | Memphis | 1,782.0 | 1,906 | -6.5% |
| 286 | Lake Winnebago | 1,773.0 | 1,131 | 56.8% |
| 287 | Campbell | 1,766.0 | 2,503 | -29.4% |
| 288 | Crane | 1,760.0 | 2,049 | -14.1% |
| 289 | Marble Hill | 1,758.0 | 1,810 | -2.9% |
| 290 | Hamilton | 1,755.0 | 2,252 | -22.1% |
| 291 | Winfield | 1,745.0 | 1,363 | 28.0% |
| 292 | Garden City | 1,742.0 | 1,714 | 1.6% |
| 293 | Gallatin | 1,740.0 | 1,861 | -6.5% |
| 294 | Bernie | 1,725.0 | 2,002 | -13.8% |
| 295 | Fair Grove | 1,717.0 | 1,343 | 27.8% |
| 296 | Ironton | 1,692.0 | 1,727 | -2.0% |
| 297 | Huntsville | 1,672.0 | 1,254 | 33.3% |
| 298 | Steelville | 1,665.0 | 1,390 | 19.8% |
| 299 | Senath | 1,662.0 | 1,934 | -14.1% |
| 300 | Shelbina | 1,653.0 | 1,795 | -7.9% |
| 301 | Bourbon | 1,636.0 | 1,922 | -14.9% |
| 302 | Wellston | 1,628.0 | 2,192 | -25.7% |
| 303 | Charlack | 1,596.0 | 1,336 | 19.5% |
| 304 | Paris | 1,587.0 | 1,452 | 9.3% |
| 305 | Wardsville | 1,579.0 | 1,654 | -4.5% |
| 306 | Sarcoxie | 1,574.0 | 1,331 | 18.3% |
| 307 | Fremont Hills | 1,574.0 | 875 | 79.9% |
| 308 | Oakland | 1,562.0 | 1,328 | 17.6% |
| 309 | Bel-Nor | 1,556.0 | 1,537 | 1.2% |
| 310 | Salisbury | 1,540.0 | 1,684 | -8.6% |
| 311 | Mansfield | 1,524.0 | 1,328 | 14.8% |
| 312 | Bismarck | 1,508.0 | 1,607 | -6.2% |
| 313 | Steele | 1,493.0 | 2,213 | -32.5% |
| 314 | Shell Knob | 1,486.0 | 1,205 | 23.3% |
| 315 | Pierce City | 1,477.0 | 1,338 | 10.4% |
| 316 | Tarkio | 1,471.0 | 1,611 | -8.7% |
| 317 | Labarque Creek | 1,457.0 | 1,495 | -2.5% |
| 318 | Rich Hill | 1,453.0 | 1,482 | -2.0% |
| 319 | Auxvasse | 1,452.0 | 1,085 | 33.8% |
| 320 | Advance | 1,450.0 | 1,422 | 2.0% |
| 321 | Cole Camp | 1,436.0 | 1,806 | -20.5% |
| 322 | Lone Jack | 1,412.0 | 901 | 56.7% |
| 323 | Cool Valley | 1,411.0 | 1,243 | 13.5% |
| 324 | Lakeshire | 1,396.0 | 1,536 | -9.1% |
| 325 | Gerald | 1,368.0 | 1,531 | -10.6% |
| 326 | Leadwood | 1,354.0 | 1,209 | 12.0% |
| 327 | Princeton | 1,352.0 | 1,094 | 23.6% |
| 328 | La Plata | 1,351.0 | 1,467 | -7.9% |
| 329 | Dixon | 1,334.0 | 1,478 | -9.7% |
| 330 | Ash Grove | 1,333.0 | 1,680 | -20.7% |
| 331 | Archie | 1,322.0 | 1,188 | 11.3% |
| 332 | Sweet Springs | 1,268.0 | 1,588 | -20.2% |
| 333 | Cedar Hill | 1,261.0 | 1,614 | -21.9% |
| 334 | Edina | 1,250.0 | 1,154 | 8.3% |
| 335 | Belle | 1,246.0 | 1,460 | -14.7% |
| 336 | Taos | 1,242.0 | 891 | 39.4% |
| 337 | Loma Linda | 1,239.0 | 554 | 123.6% |
| 338 | Stanberry | 1,235.0 | 1,063 | 16.2% |
| 339 | Greenfield | 1,229.0 | 1,554 | -20.9% |
| 340 | St. Martins | 1,228.0 | 1,117 | 9.9% |
| 341 | Rock Port | 1,221.0 | 1,479 | -17.4% |
| 342 | Appleton City | 1,221.0 | 1,258 | -2.9% |
| 343 | Linn | 1,197.0 | 1,662 | -28.0% |
| 344 | Flordell Hills | 1,195.0 | 853 | 40.1% |
| 345 | Pasadena Hills | 1,190.0 | 1,110 | 7.2% |
| 346 | New Franklin | 1,170.0 | 1,293 | -9.5% |
| 347 | Lake Waukomis | 1,170.0 | 981 | 19.3% |
| 348 | Wellsville | 1,165.0 | 1,253 | -7.0% |
| 349 | Van Buren | 1,161.0 | 606 | 91.6% |
| 350 | Velda City | 1,158.0 | 1,431 | -19.1% |
| 351 | New London | 1,130.0 | 1,069 | 5.7% |
| 352 | La Monte | 1,126.0 | 1,069 | 5.3% |
| 353 | Purdy | 1,121.0 | 1,082 | 3.6% |
| 354 | Glasgow | 1,118.0 | 1,336 | -16.3% |
| 355 | Reeds Spring | 1,112.0 | 1,078 | 3.2% |
| 356 | Foristell | 1,096.0 | 592 | 85.1% |
| 357 | Kissee Mills | 1,081.0 | 1,317 | -17.9% |
| 358 | Mound City | 1,066.0 | 1,093 | -2.5% |
| 359 | Humansville | 1,058.0 | 1,109 | -4.6% |
| 360 | Grantwood Village | 1,058.0 | 889 | 19.0% |
| 361 | Ellington | 1,057.0 | 1,068 | -1.0% |
| 362 | Osceola | 1,042.0 | 737 | 41.4% |
| 363 | Sturgeon | 1,035.0 | 831 | 24.5% |
| 364 | La Grange | 1,033.0 | 910 | 13.5% |
| 365 | Oran | 1,033.0 | 1,396 | -26.0% |
| 366 | Crocker | 1,024.0 | 1,367 | -25.1% |
| 367 | Gainesville | 1,010.0 | 833 | 21.2% |