Bolivar, MO
Demographics And Statistics
Living In Bolivar, Missouri Summary
Life in Bolivar research summary. HomeSnacks has been using Saturday Night Science to research the quality of life in Bolivar over the past nine years using Census, FBI, Zillow, and other primary data sources. Based on the most recently available data, we found the following about life in Bolivar:
The population in Bolivar is 10,996.
The median home value in Bolivar is $252,719.
The median income in Bolivar is $44,603.
The cost of living in Bolivar is 82 which is 0.8x lower than the national average.
The median rent in Bolivar is $833.
The unemployment rate in Bolivar is 4.4%.
The poverty rate in Bolivar is 21.1%.
The average high in Bolivar is 66.9° and the average low is 44.6°.
Bolivar SnackAbility
Overall SnackAbility
Bolivar, MO Crime Report
Crime in Bolivar summary. We use data from the FBI to determine the crime rates in Bolivar. Key points include:
There were 138 total crimes in Bolivar in the last reporting year.
The overall crime rate per 100,000 people in Bolivar is 1,197.6 / 100k people.
The violent crime rate per 100,000 people in Bolivar is 173.6 / 100k people.
The property crime rate per 100,000 people in Bolivar is 1,024.0 / 100k people.
Overall, crime in Bolivar is -43.49% below the national average.
Total Crimes
Below National Average
Crime In Bolivar Comparison Table
| Statistic | Count Raw |
Bolivar / 100k People |
Missouri / 100k People |
National / 100k People |
|---|---|---|---|---|
| Total Crimes Per 100K | 138 | 1,197.6 | 2,403.3 | 2,119.2 |
| Violent Crime | 20 | 173.6 | 462.0 | 359.0 |
| Murder | 0 | 0.0 | 7.8 | 5.0 |
| Robbery | 1 | 8.7 | 51.5 | 61.0 |
| Aggravated Assault | 8 | 69.4 | 357.5 | 256.0 |
| Property Crime | 118 | 1,024.0 | 1,941.2 | 1,760.0 |
| Burglary | 13 | 112.8 | 236.3 | 229.0 |
| Larceny | 97 | 841.8 | 1,306.5 | 1,272.0 |
| Car Theft | 8 | 69.4 | 398.4 | 259.0 |
Bolivar, MO Cost Of Living
Cost of living in Bolivar summary. We use data on the cost of living to determine how expensive it is to live in Bolivar. Real estate prices drive most of the variance in cost of living around Missouri. Key points include:
The cost of living in Bolivar is 82 with 100 being average.
The cost of living in Bolivar is 0.8x lower than the national average.
The median home value in Bolivar is $252,719.
The median income in Bolivar is $44,603.
Bolivar's Overall Cost Of Living
Lower Than The National Average
Cost Of Living In Bolivar Comparison Table
| Living Expense | Bolivar | Missouri | National Average | |
|---|---|---|---|---|
| Overall | 82 | 88 | 100 | |
| Services | 91 | 93 | 100 | |
| Groceries | 95 | 96 | 100 | |
| Health | 94 | 91 | 100 | |
| Housing | 73 | 78 | 100 | |
| Transportation | 92 | 90 | 100 | |
| Utilities | 78 | 99 | 100 | |
Bolivar, MO Weather
The average high in Bolivar is 66.9° and the average low is 44.6°.
There are 71.8 days of precipitation each year.
Expect an average of 46.4 inches of precipitation each year with 12.7 inches of snow.
| Stat | Bolivar |
|---|---|
| Average Annual High | 66.9 |
| Average Annual Low | 44.6 |
| Annual Precipitation Days | 71.8 |
| Average Annual Precipitation | 46.4 |
| Average Annual Snowfall | 12.7 |
Average High
Days of Rain
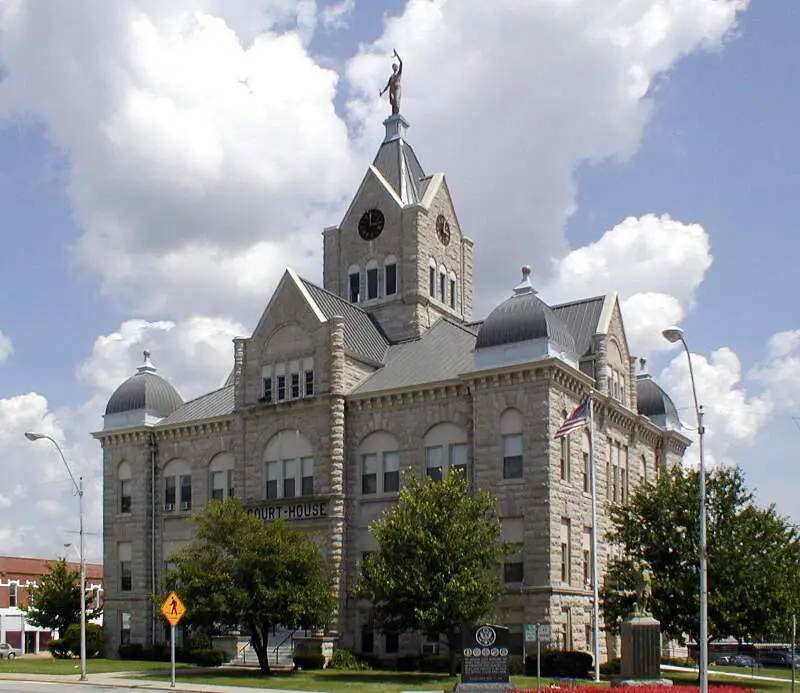
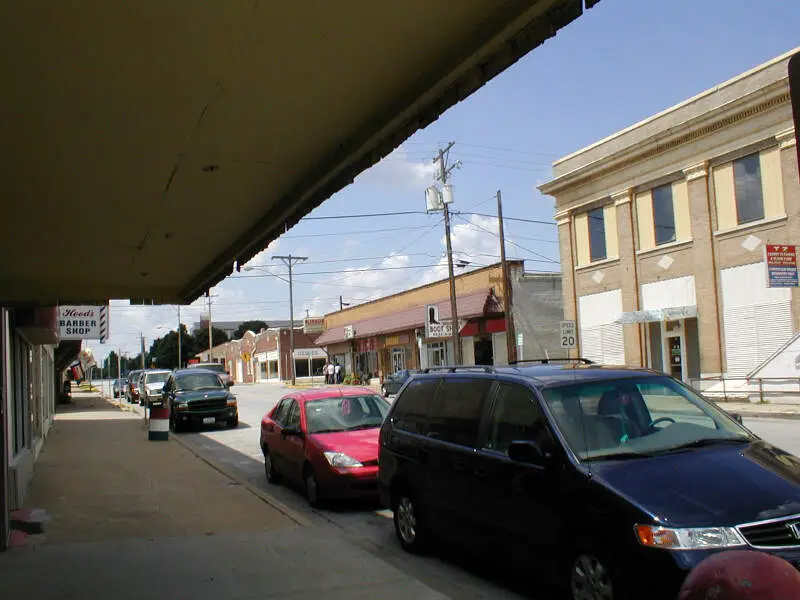
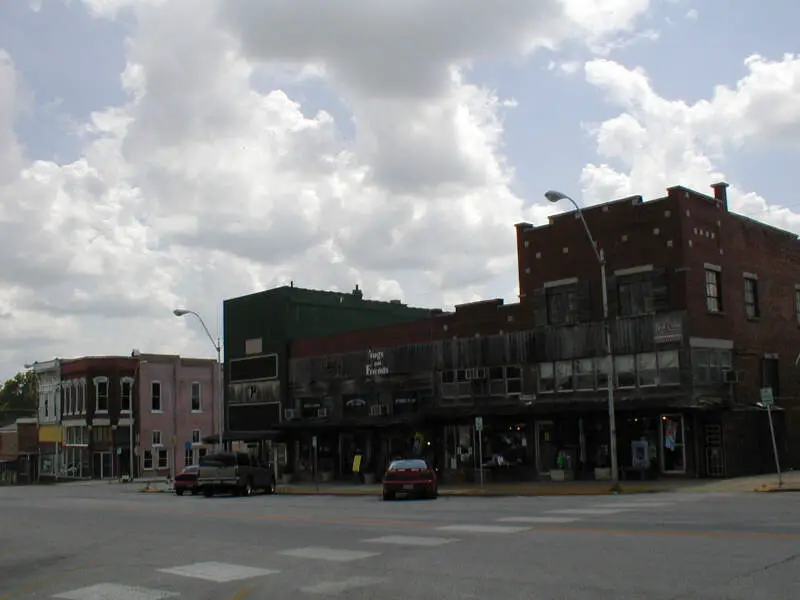
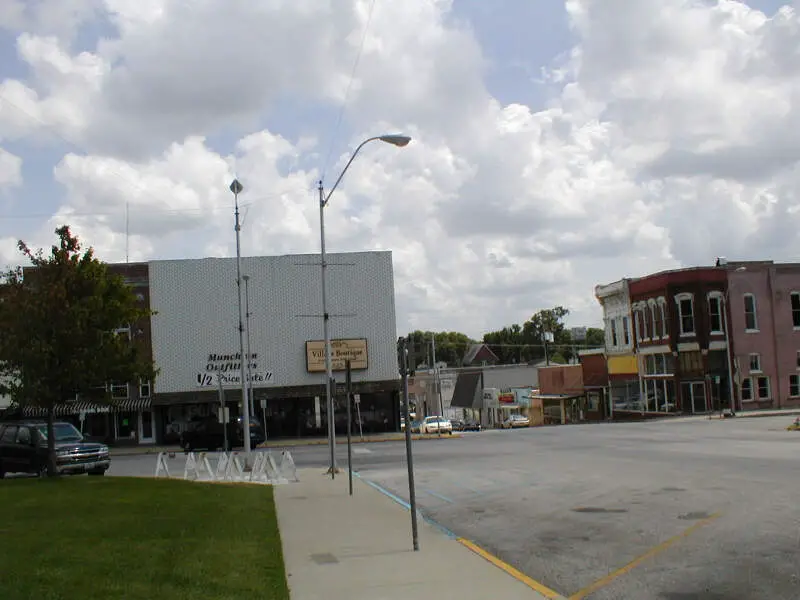
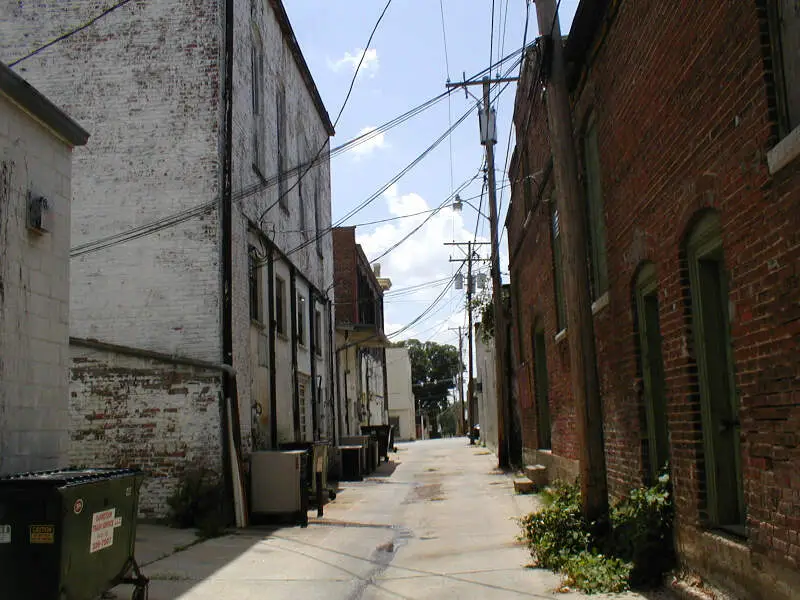
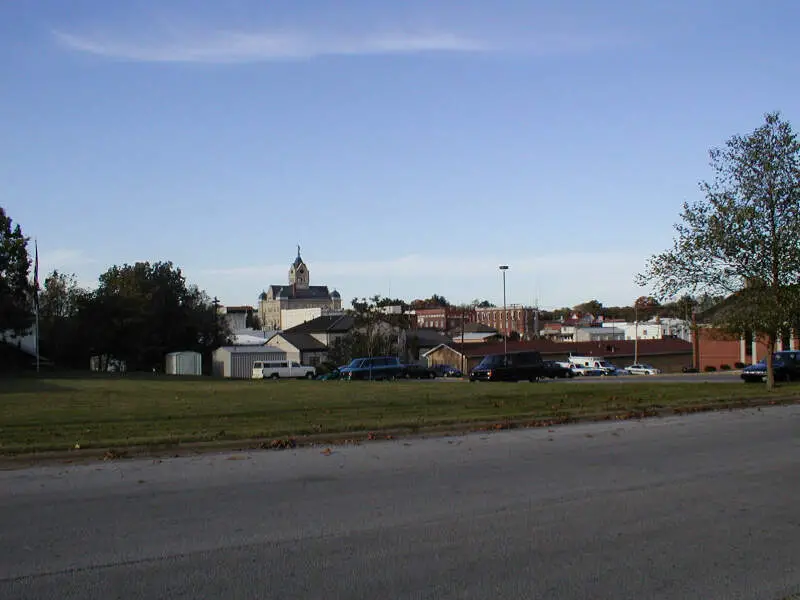
Bolivar, MO Photos
Rankings for Bolivar in Missouri


Locations Around Bolivar
Map Of Bolivar, MO
Best Places Around Bolivar
Battlefield, MO
Population 6,095
Nixa, MO
Population 24,131
Willard, MO
Population 6,418
Ozark, MO
Population 21,953
Republic, MO
Population 19,233
Marshfield, MO
Population 7,599
Aurora, MO
Population 7,331
Springfield, MO
Population 169,432
Lebanon, MO
Population 15,157
Bolivar Demographics And Statistics
Population over time in Bolivar
The current population in Bolivar is 10,996. The population has increased 7.6% from 2010.
| Year | Population | % Change |
|---|---|---|
| 2023 | 10,996 | 2.0% |
| 2022 | 10,780 | 0.6% |
| 2021 | 10,718 | -2.6% |
| 2020 | 11,000 | 1.1% |
| 2019 | 10,880 | 1.1% |
| 2018 | 10,760 | 1.0% |
| 2017 | 10,654 | 0.6% |
| 2016 | 10,592 | 0.8% |
| 2015 | 10,507 | 0.6% |
| 2014 | 10,443 | 0.4% |
| 2013 | 10,398 | 0.6% |
| 2012 | 10,331 | 0.4% |
| 2011 | 10,289 | 0.7% |
| 2010 | 10,222 | - |
Race / Ethnicity in Bolivar
Bolivar is:
92.1% White with 10,123 White residents.
0.8% African American with 87 African American residents.
0.2% American Indian with 23 American Indian residents.
0.3% Asian with 31 Asian residents.
0.0% Hawaiian with 0 Hawaiian residents.
0.1% Other with 13 Other residents.
3.0% Two Or More with 335 Two Or More residents.
3.5% Hispanic with 384 Hispanic residents.
| Race | Bolivar | MO | USA |
|---|---|---|---|
| White | 92.1% | 76.8% | 58.2% |
| African American | 0.8% | 11.0% | 12.0% |
| American Indian | 0.2% | 0.2% | 0.5% |
| Asian | 0.3% | 2.1% | 5.7% |
| Hawaiian | 0.0% | 0.1% | 0.2% |
| Other | 0.1% | 0.4% | 0.5% |
| Two Or More | 3.0% | 4.4% | 3.9% |
| Hispanic | 3.5% | 5.1% | 19.0% |
Gender in Bolivar
Bolivar is 54.4% female with 5,980 female residents.
Bolivar is 45.6% male with 5,016 male residents.
| Gender | Bolivar | MO | USA |
|---|---|---|---|
| Female | 54.4% | 50.7% | 50.5% |
| Male | 45.6% | 49.3% | 49.5% |
Highest level of educational attainment in Bolivar for adults over 25
3.0% of adults in Bolivar completed < 9th grade.
8.0% of adults in Bolivar completed 9-12th grade.
33.0% of adults in Bolivar completed high school / ged.
20.0% of adults in Bolivar completed some college.
10.0% of adults in Bolivar completed associate's degree.
14.0% of adults in Bolivar completed bachelor's degree.
7.0% of adults in Bolivar completed master's degree.
2.0% of adults in Bolivar completed professional degree.
3.0% of adults in Bolivar completed doctorate degree.
| Education | Bolivar | MO | USA |
|---|---|---|---|
| < 9th Grade | 3.0% | 3.0% | 5.0% |
| 9-12th Grade | 8.0% | 6.0% | 6.0% |
| High School / GED | 33.0% | 30.0% | 26.0% |
| Some College | 20.0% | 21.0% | 19.0% |
| Associate's Degree | 10.0% | 8.0% | 9.0% |
| Bachelor's Degree | 14.0% | 20.0% | 21.0% |
| Master's Degree | 7.0% | 9.0% | 10.0% |
| Professional Degree | 2.0% | 2.0% | 2.0% |
| Doctorate Degree | 3.0% | 1.0% | 2.0% |
Household Income For Bolivar, Missouri
2.6% of households in Bolivar earn Less than $10,000.
7.3% of households in Bolivar earn $10,000 to $14,999.
19.1% of households in Bolivar earn $15,000 to $24,999.
10.0% of households in Bolivar earn $25,000 to $34,999.
16.5% of households in Bolivar earn $35,000 to $49,999.
14.4% of households in Bolivar earn $50,000 to $74,999.
9.0% of households in Bolivar earn $75,000 to $99,999.
14.4% of households in Bolivar earn $100,000 to $149,999.
3.7% of households in Bolivar earn $150,000 to $199,999.
3.1% of households in Bolivar earn $200,000 or more.
| Income | Bolivar | MO | USA |
|---|---|---|---|
| Less than $10,000 | 2.6% | 4.8% | 4.9% |
| $10,000 to $14,999 | 7.3% | 4.0% | 3.6% |
| $15,000 to $24,999 | 19.1% | 7.6% | 6.6% |
| $25,000 to $34,999 | 10.0% | 7.9% | 6.8% |
| $35,000 to $49,999 | 16.5% | 12.2% | 10.4% |
| $50,000 to $74,999 | 14.4% | 17.5% | 15.7% |
| $75,000 to $99,999 | 9.0% | 13.3% | 12.7% |
| $100,000 to $149,999 | 14.4% | 16.9% | 17.4% |
| $150,000 to $199,999 | 3.7% | 7.7% | 9.3% |
| $200,000 or more | 3.1% | 8.1% | 12.6% |


