Florissant SnackAbility
Overall SnackAbility
Crime in Florissant summary. We use data from the FBI to determine the crime rates in Florissant. Key points include:
There were 1,102 total crimes in Florissant in the last reporting year.
The overall crime rate per 100,000 people in Florissant is 2,173.8 / 100k people.
The violent crime rate per 100,000 people in Florissant is 341.3 / 100k people.
The property crime rate per 100,000 people in Florissant is 1,832.5 / 100k people.
Overall, crime in Florissant is 2.57% above the national average.
Total Crimes
Above National Average
Crime In Florissant Comparison Table
| Statistic | Count Raw |
Florissant / 100k People |
Missouri / 100k People |
National / 100k People |
|---|---|---|---|---|
| Total Crimes Per 100K | 1,102 | 2,173.8 | 2,403.3 | 2,119.2 |
| Violent Crime | 173 | 341.3 | 462.0 | 359.0 |
| Murder | 2 | 3.9 | 7.8 | 5.0 |
| Robbery | 24 | 47.3 | 51.5 | 61.0 |
| Aggravated Assault | 118 | 232.8 | 357.5 | 256.0 |
| Property Crime | 929 | 1,832.5 | 1,941.2 | 1,760.0 |
| Burglary | 75 | 147.9 | 236.3 | 229.0 |
| Larceny | 548 | 1,081.0 | 1,306.5 | 1,272.0 |
| Car Theft | 306 | 603.6 | 398.4 | 259.0 |
Source: FBI Uniform Crime Reporting (2024)
Cost of living in Florissant summary. We use data on the cost of living to determine how expensive it is to live in Florissant. Real estate prices drive most of the variance in cost of living around Missouri. Key points include:
The cost of living in Florissant is 88 with 100 being average.
The cost of living in Florissant is 0.9x lower than the national average.
The median home value in Florissant is $191,523.
The median income in Florissant is $65,318.
Florissant's Overall Cost Of Living
Lower Than The National Average
Cost Of Living In Florissant Comparison Table
| Living Expense | Florissant | Missouri | National Average |
|---|---|---|---|
| Overall | 88 | 90 | 100 |
| Services | 97 | 97 | 100 |
| Groceries | 91 | 98 | 100 |
| Health | 73 | 76 | 100 |
| Housing | 95 | 95 | 100 |
| Transportation | 98 | 94 | 100 |
| Utilities | 94 | 96 | 100 |
Source: Cost of living index, normalized to US average = 100
Florissant, MO Weather
The average high in Florissant is 65.7° and the average low is 46.9°.
There are 70.0 days of precipitation each year.
Expect an average of 41.5 inches of precipitation each year with 15.1 inches of snow.
| Stat | Florissant |
|---|---|
| Average Annual High | 65.7 |
| Average Annual Low | 46.9 |
| Annual Precipitation Days | 70.0 |
| Average Annual Precipitation | 41.5 |
| Average Annual Snowfall | 15.1 |
Average High
Days of Rain
Source: NOAA climate normals (30-year)
Florissant, MO Photos
Rankings & Articles For Florissant


Locations Around Florissant
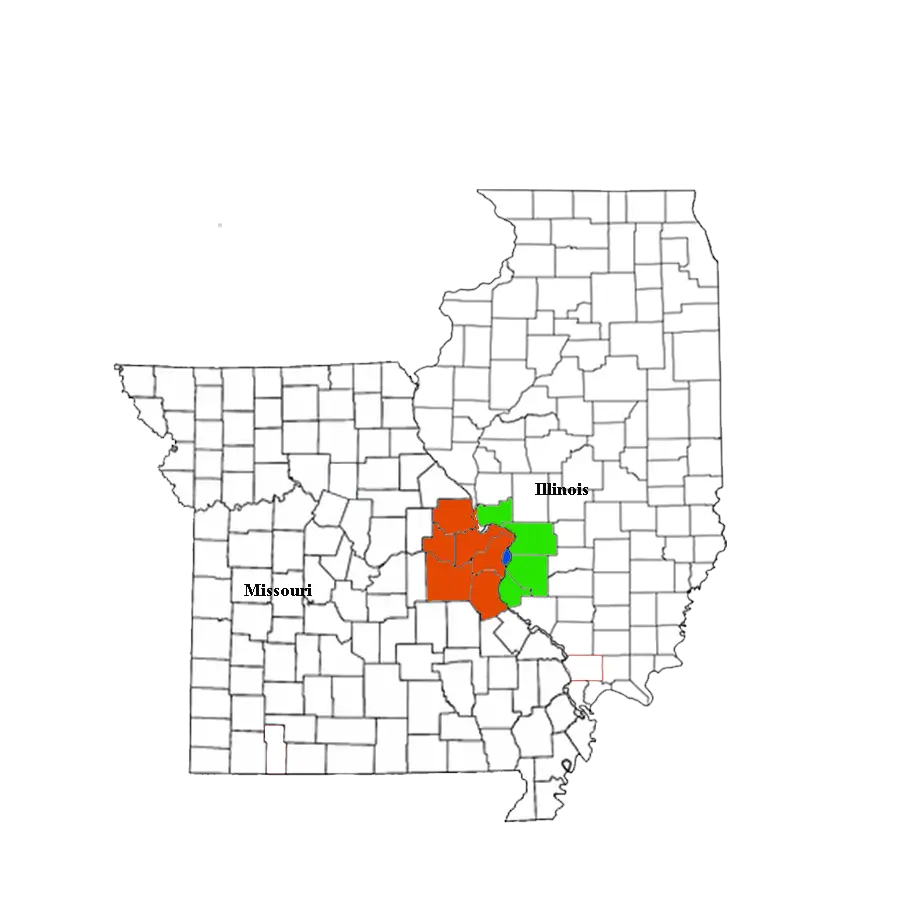
Map Of Florissant, MO
Best Places Around Florissant
Edwardsville, IL
Population 26,474
Bethalto, IL
Population 9,239
Glen Carbon, IL
Population 13,977
Godfrey, IL
Population 17,712
Pontoon Beach, IL
Population 6,025
Collinsville, IL
Population 24,031
Wood River, IL
Population 10,279
Ballwin, MO
Population 31,279
Chesterfield, MO
Population 49,574
Town and Country, MO
Population 11,607
Florissant Demographics And Statistics
Population over time in Florissant
The current population in Florissant is 51,773. The population has decreased 1.3% from 2010.
| Year | Population | % Change |
|---|---|---|
| 2024 | 51,773 | -0.3% |
| 2023 | 51,915 | -0.5% |
| 2022 | 52,167 | -0.4% |
| 2021 | 52,382 | 2.3% |
| 2020 | 51,220 | -0.5% |
| 2019 | 51,455 | -0.6% |
| 2018 | 51,744 | -0.4% |
| 2017 | 51,952 | -0.5% |
| 2016 | 52,218 | -0.3% |
| 2015 | 52,356 | 0.0% |
| 2014 | 52,353 | 0.0% |
| 2013 | 52,335 | 0.1% |
| 2012 | 52,273 | -0.1% |
| 2011 | 52,301 | -0.3% |
| 2010 | 52,462 | - |
Race / Ethnicity in Florissant
See the full breakdown
Florissant is:
45.4% White with 23,527 White residents.
43.9% African American with 22,732 African American residents.
0.0% American Indian with 13 American Indian residents.
0.9% Asian with 455 Asian residents.
0.0% Hawaiian with 0 Hawaiian residents.
0.5% Other with 284 Other residents.
6.8% Two Or More with 3,501 Two Or More residents.
2.4% Hispanic with 1,261 Hispanic residents.
| Race | Florissant | MO | USA |
|---|---|---|---|
| White | 45.4% | 76.3% | 57.4% |
| African American | 43.9% | 10.9% | 11.9% |
| American Indian | 0.0% | 0.2% | 0.5% |
| Asian | 0.9% | 2.1% | 5.9% |
| Hawaiian | 0.0% | 0.1% | 0.2% |
| Other | 0.5% | 0.4% | 0.6% |
| Two Or More | 6.8% | 4.8% | 4.3% |
| Hispanic | 2.4% | 5.2% | 19.3% |
Gender in Florissant
See the full breakdown
Florissant is 52.8% female with 27,318 female residents.
Florissant is 47.2% male with 24,455 male residents.
| Gender | Florissant | MO | USA |
|---|---|---|---|
| Female | 52.8% | 50.7% | 50.5% |
| Male | 47.2% | 49.3% | 49.5% |
Highest level of educational attainment in Florissant for adults over 25
See the full breakdown
-0.0% of adults in Florissant completed < 9th grade.
5.0% of adults in Florissant completed 9-12th grade.
31.0% of adults in Florissant completed high school / ged.
26.0% of adults in Florissant completed some college.
14.0% of adults in Florissant completed associate's degree.
16.0% of adults in Florissant completed bachelor's degree.
6.0% of adults in Florissant completed master's degree.
1.0% of adults in Florissant completed professional degree.
1.0% of adults in Florissant completed doctorate degree.
| Education | Florissant | MO | USA |
|---|---|---|---|
| < 9th Grade | -0.0% | 4.0% | 4.0% |
| 9-12th Grade | 5.0% | 5.0% | 6.0% |
| High School / GED | 31.0% | 30.0% | 26.0% |
| Some College | 26.0% | 21.0% | 19.0% |
| Associate's Degree | 14.0% | 8.0% | 9.0% |
| Bachelor's Degree | 16.0% | 20.0% | 22.0% |
| Master's Degree | 6.0% | 9.0% | 10.0% |
| Professional Degree | 1.0% | 2.0% | 2.0% |
| Doctorate Degree | 1.0% | 1.0% | 2.0% |
Household Income For Florissant, Missouri
See the full breakdown
3.8% of households in Florissant earn Less than $10,000.
1.9% of households in Florissant earn $10,000 to $14,999.
6.7% of households in Florissant earn $15,000 to $24,999.
9.2% of households in Florissant earn $25,000 to $34,999.
13.5% of households in Florissant earn $35,000 to $49,999.
21.7% of households in Florissant earn $50,000 to $74,999.
15.2% of households in Florissant earn $75,000 to $99,999.
21.0% of households in Florissant earn $100,000 to $149,999.
4.3% of households in Florissant earn $150,000 to $199,999.
2.7% of households in Florissant earn $200,000 or more.
| Income | Florissant | MO | USA |
|---|---|---|---|
| Less than $10,000 | 3.8% | 4.9% | 5.0% |
| $10,000 to $14,999 | 1.9% | 3.8% | 3.4% |
| $15,000 to $24,999 | 6.7% | 7.1% | 6.3% |
| $25,000 to $34,999 | 9.2% | 7.8% | 6.6% |
| $35,000 to $49,999 | 13.5% | 11.9% | 10.1% |
| $50,000 to $74,999 | 21.7% | 17.4% | 15.5% |
| $75,000 to $99,999 | 15.2% | 13.2% | 12.6% |
| $100,000 to $149,999 | 21.0% | 17.1% | 17.5% |
| $150,000 to $199,999 | 4.3% | 8.2% | 9.6% |
| $200,000 or more | 2.7% | 8.7% | 13.4% |
Source: U.S. Census ACS 5-year estimates (2024)


