O'fallon SnackAbility
Overall SnackAbility
Crime in O'Fallon summary. We use data from the FBI to determine the crime rates in O'Fallon. Key points include:
There were 511 total crimes in O'Fallon in the last reporting year.
The overall crime rate per 100,000 people in O'Fallon is 538.4 / 100k people.
The violent crime rate per 100,000 people in O'Fallon is 59.0 / 100k people.
The property crime rate per 100,000 people in O'Fallon is 479.4 / 100k people.
Overall, crime in O'Fallon is -74.59% below the national average.
Total Crimes
Below National Average
Crime In O'Fallon Comparison Table
| Statistic | Count Raw |
O'Fallon / 100k People |
Missouri / 100k People |
National / 100k People |
|---|---|---|---|---|
| Total Crimes Per 100K | 511 | 538.4 | 2,403.3 | 2,119.2 |
| Violent Crime | 56 | 59.0 | 462.0 | 359.0 |
| Murder | 0 | 0.0 | 7.8 | 5.0 |
| Robbery | 1 | 1.1 | 51.5 | 61.0 |
| Aggravated Assault | 38 | 40.0 | 357.5 | 256.0 |
| Property Crime | 455 | 479.4 | 1,941.2 | 1,760.0 |
| Burglary | 29 | 30.6 | 236.3 | 229.0 |
| Larceny | 392 | 413.0 | 1,306.5 | 1,272.0 |
| Car Theft | 34 | 35.8 | 398.4 | 259.0 |
Source: FBI Uniform Crime Reporting (2024)
Cost of living in O'Fallon summary. We use data on the cost of living to determine how expensive it is to live in O'Fallon. Real estate prices drive most of the variance in cost of living around Missouri. Key points include:
The cost of living in O'Fallon is 105 with 100 being average.
The cost of living in O'Fallon is 1.1x higher than the national average.
The median home value in O'Fallon is $376,395.
The median income in O'Fallon is $110,443.
O'fallon's Overall Cost Of Living
Higher Than The National Average
Cost Of Living In O'Fallon Comparison Table
| Living Expense | O'Fallon | Missouri | National Average |
|---|---|---|---|
| Overall | 105 | 90 | 100 |
| Services | 93 | 97 | 100 |
| Groceries | 97 | 98 | 100 |
| Health | 127 | 76 | 100 |
| Housing | 95 | 95 | 100 |
| Transportation | 93 | 94 | 100 |
| Utilities | 96 | 96 | 100 |
Source: Cost of living index, normalized to US average = 100
O'fallon, MO Weather
The average high in O'Fallon is 65.8° and the average low is 45.1°.
There are 69.0 days of precipitation each year.
Expect an average of 42.3 inches of precipitation each year with 13.4 inches of snow.
| Stat | O'Fallon |
|---|---|
| Average Annual High | 65.8 |
| Average Annual Low | 45.1 |
| Annual Precipitation Days | 69.0 |
| Average Annual Precipitation | 42.3 |
| Average Annual Snowfall | 13.4 |
Average High
Days of Rain
Source: NOAA climate normals (30-year)
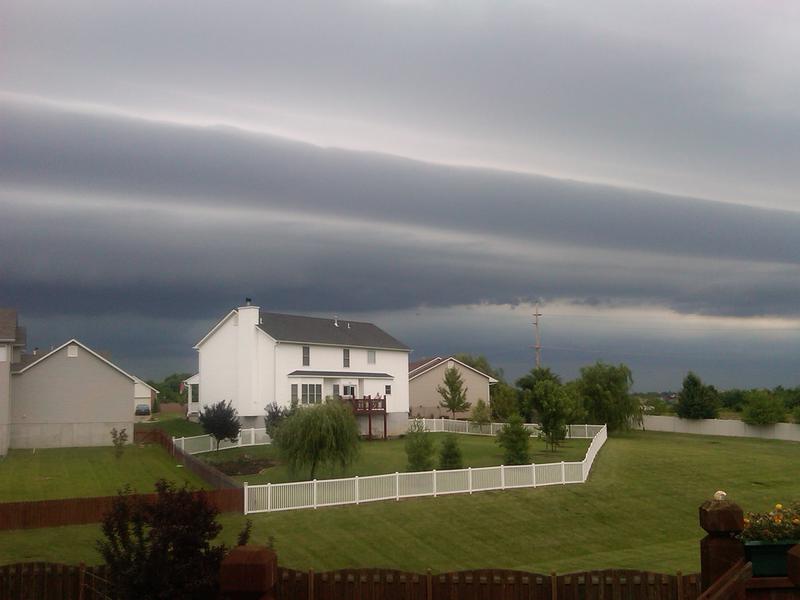
O'fallon, MO Photos
Rankings & Articles For O'Fallon


Locations Around O'Fallon
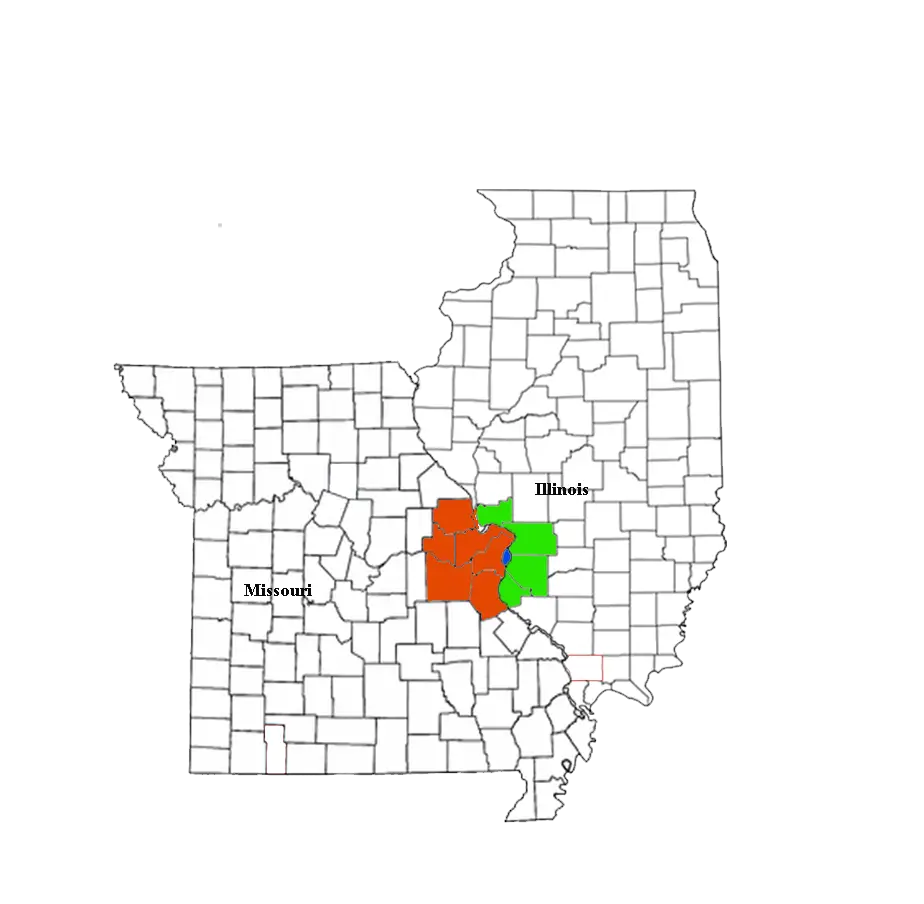
Map Of O'Fallon, MO
Best Places Around O'Fallon
Wildwood, MO
Population 35,133
Ballwin, MO
Population 31,279
Chesterfield, MO
Population 49,574
Dardenne Prairie, MO
Population 13,503
Town and Country, MO
Population 11,607
Weldon Spring, MO
Population 5,310
Manchester, MO
Population 18,160
Lake St. Louis, MO
Population 18,066
Creve Coeur, MO
Population 18,643
Des Peres, MO
Population 9,170
O'Fallon Demographics And Statistics
Population over time in O'Fallon
The current population in O'Fallon is 93,801. The population has increased 25.4% from 2010.
| Year | Population | % Change |
|---|---|---|
| 2024 | 93,801 | 1.2% |
| 2023 | 92,697 | 0.9% |
| 2022 | 91,825 | 1.1% |
| 2021 | 90,802 | 3.0% |
| 2020 | 88,132 | 1.0% |
| 2019 | 87,242 | 1.0% |
| 2018 | 86,340 | 1.3% |
| 2017 | 85,246 | 1.5% |
| 2016 | 84,018 | 1.2% |
| 2015 | 83,053 | 1.3% |
| 2014 | 81,978 | 1.7% |
| 2013 | 80,617 | 2.0% |
| 2012 | 79,073 | 2.6% |
| 2011 | 77,036 | 3.0% |
| 2010 | 74,777 | - |
Race / Ethnicity in O'Fallon
See the full breakdown
O'Fallon is:
79.5% White with 74,564 White residents.
5.2% African American with 4,908 African American residents.
0.1% American Indian with 52 American Indian residents.
4.8% Asian with 4,526 Asian residents.
0.0% Hawaiian with 14 Hawaiian residents.
0.5% Other with 497 Other residents.
4.3% Two Or More with 4,040 Two Or More residents.
5.5% Hispanic with 5,200 Hispanic residents.
| Race | O'Fallon | MO | USA |
|---|---|---|---|
| White | 79.5% | 76.3% | 57.4% |
| African American | 5.2% | 10.9% | 11.9% |
| American Indian | 0.1% | 0.2% | 0.5% |
| Asian | 4.8% | 2.1% | 5.9% |
| Hawaiian | 0.0% | 0.1% | 0.2% |
| Other | 0.5% | 0.4% | 0.6% |
| Two Or More | 4.3% | 4.8% | 4.3% |
| Hispanic | 5.5% | 5.2% | 19.3% |
Gender in O'Fallon
See the full breakdown
O'Fallon is 51.2% female with 48,041 female residents.
O'Fallon is 48.8% male with 45,759 male residents.
| Gender | O'Fallon | MO | USA |
|---|---|---|---|
| Female | 51.2% | 50.7% | 50.5% |
| Male | 48.8% | 49.3% | 49.5% |
Highest level of educational attainment in O'Fallon for adults over 25
See the full breakdown
2.0% of adults in O'Fallon completed < 9th grade.
3.0% of adults in O'Fallon completed 9-12th grade.
23.0% of adults in O'Fallon completed high school / ged.
20.0% of adults in O'Fallon completed some college.
9.0% of adults in O'Fallon completed associate's degree.
28.0% of adults in O'Fallon completed bachelor's degree.
13.0% of adults in O'Fallon completed master's degree.
1.0% of adults in O'Fallon completed professional degree.
1.0% of adults in O'Fallon completed doctorate degree.
| Education | O'Fallon | MO | USA |
|---|---|---|---|
| < 9th Grade | 2.0% | 4.0% | 4.0% |
| 9-12th Grade | 3.0% | 5.0% | 6.0% |
| High School / GED | 23.0% | 30.0% | 26.0% |
| Some College | 20.0% | 21.0% | 19.0% |
| Associate's Degree | 9.0% | 8.0% | 9.0% |
| Bachelor's Degree | 28.0% | 20.0% | 22.0% |
| Master's Degree | 13.0% | 9.0% | 10.0% |
| Professional Degree | 1.0% | 2.0% | 2.0% |
| Doctorate Degree | 1.0% | 1.0% | 2.0% |
Household Income For O'Fallon, Missouri
See the full breakdown
2.7% of households in O'Fallon earn Less than $10,000.
2.0% of households in O'Fallon earn $10,000 to $14,999.
2.8% of households in O'Fallon earn $15,000 to $24,999.
3.2% of households in O'Fallon earn $25,000 to $34,999.
8.1% of households in O'Fallon earn $35,000 to $49,999.
12.9% of households in O'Fallon earn $50,000 to $74,999.
11.7% of households in O'Fallon earn $75,000 to $99,999.
24.7% of households in O'Fallon earn $100,000 to $149,999.
16.3% of households in O'Fallon earn $150,000 to $199,999.
15.7% of households in O'Fallon earn $200,000 or more.
| Income | O'Fallon | MO | USA |
|---|---|---|---|
| Less than $10,000 | 2.7% | 4.9% | 5.0% |
| $10,000 to $14,999 | 2.0% | 3.8% | 3.4% |
| $15,000 to $24,999 | 2.8% | 7.1% | 6.3% |
| $25,000 to $34,999 | 3.2% | 7.8% | 6.6% |
| $35,000 to $49,999 | 8.1% | 11.9% | 10.1% |
| $50,000 to $74,999 | 12.9% | 17.4% | 15.5% |
| $75,000 to $99,999 | 11.7% | 13.2% | 12.6% |
| $100,000 to $149,999 | 24.7% | 17.1% | 17.5% |
| $150,000 to $199,999 | 16.3% | 8.2% | 9.6% |
| $200,000 or more | 15.7% | 8.7% | 13.4% |
Source: U.S. Census ACS 5-year estimates (2024)


