Most Asian cities in Nebraska research summary. We analyzed Nebraska’s most recent Census data to determine the most Asian cities in Nebraska based on the percentage of Asian residents.
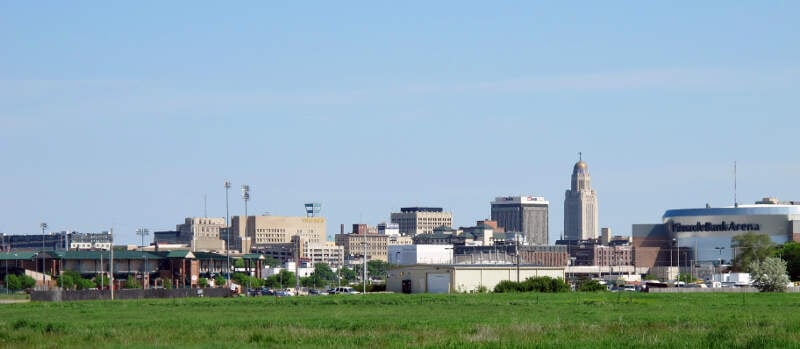
4.4% Asian · #1 most Asian in Nebraska
Lincoln is the capital of the U.S. state of Nebraska and the county seat of Lancaster County. The city covers 93.46 square miles with a population of 280,364 in 2016. It is the second-most populous city in Nebraska and the 71st-largest in the United States. The city is the economic and cultural anchor of a substantially larger metropolitan area in the southeastern part of the state called the Lincoln Metropolitan and Lincoln-Beatrice Combined Statistical Areas. The statistical area is home to 348,720 people, making it the 105th-largest combined statistical area in the United States.
Data | Crime | Cost of living | Movers
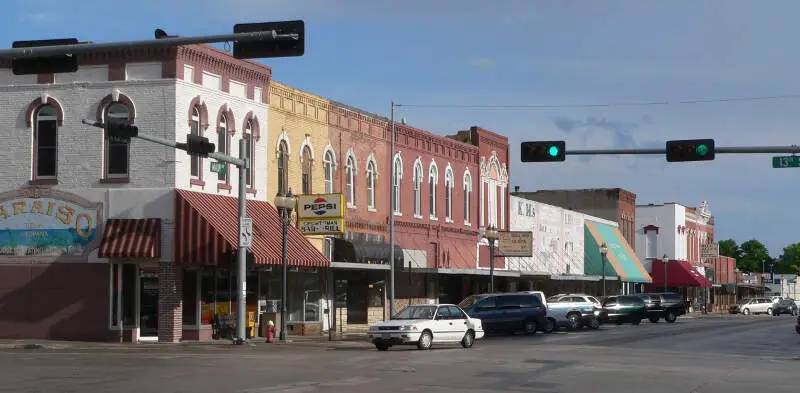
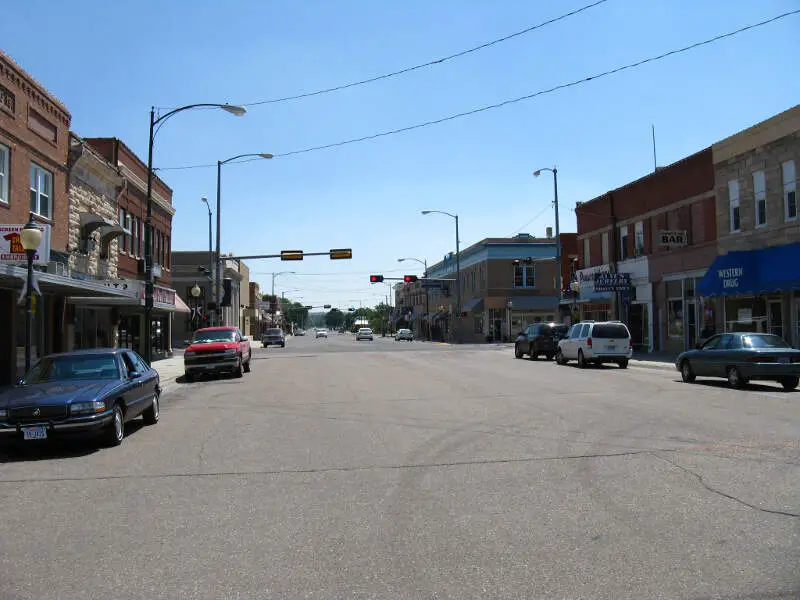
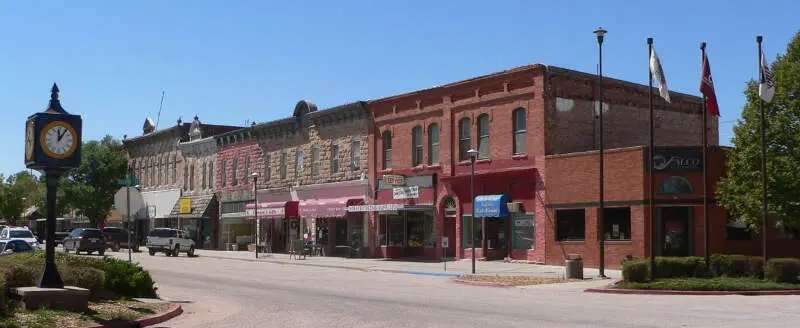
4.3% Asian · #2 most Asian in Nebraska
Crete is a city in Saline County, Nebraska, United States. The population was 6,960 at the 2010 census.
Data | Crime | Cost of living | Movers
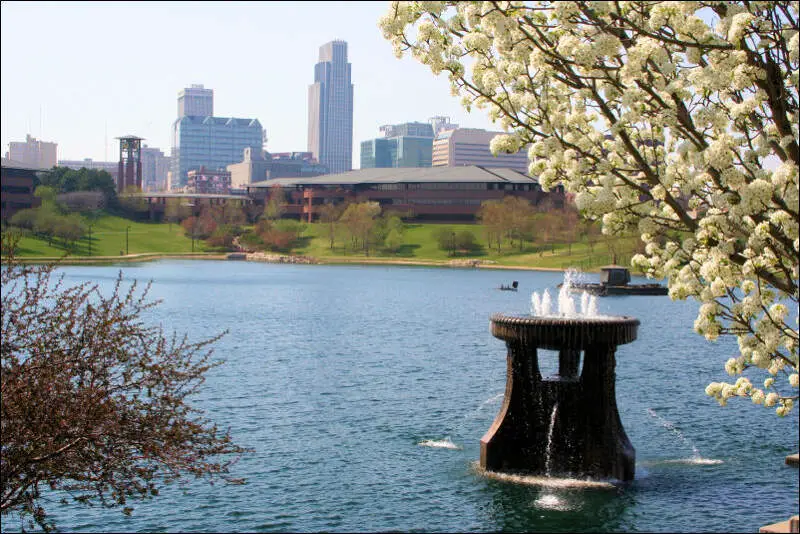
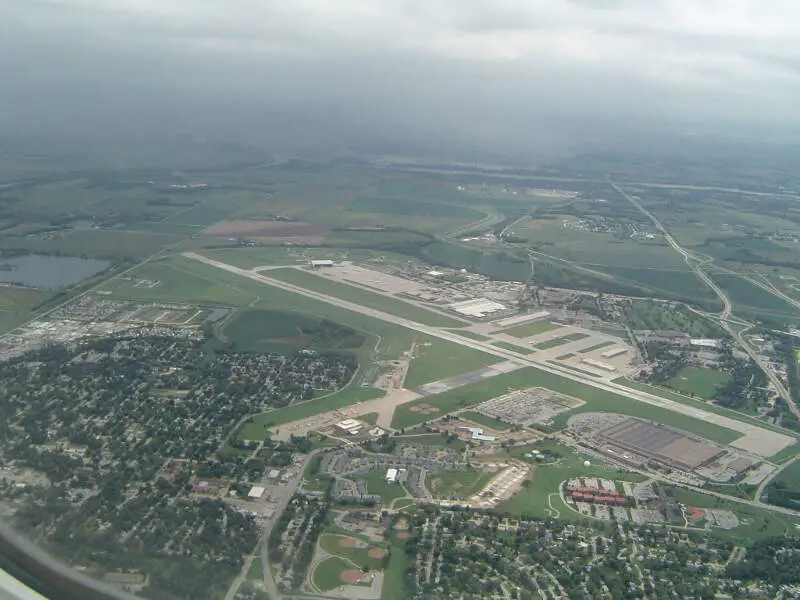
4.0% Asian · #3 most Asian in Nebraska
Omaha is the largest city in the state of Nebraska and the county seat of Douglas County. Omaha is located in the Midwestern United States on the Missouri River, about 10 miles north of the mouth of the Platte River. Omaha is the anchor of the Omaha-Council Bluffs metropolitan area, which includes Council Bluffs, Iowa, across the Missouri River from Omaha. According to the 2010 census, Omaha’s population was 408,958, making it the nation’s 44th-largest city; this had increased to 446,970 as of a 2016 estimate. Including its suburbs, Omaha formed the 60th-largest metropolitan area in the United States in 2013, with an estimated population of 895,151 residing in eight counties. The Omaha-Council Bluffs-Fremont, Nebraska-IA Combined Statistical Area is 931,667, according to the U.S. Census Bureau’s 2013 estimate. Nearly 1.3 million people reside within the Greater Omaha area, comprising a 50-mile radius of Downtown Omaha, the city’s center.
Data | Crime | Cost of living | Movers
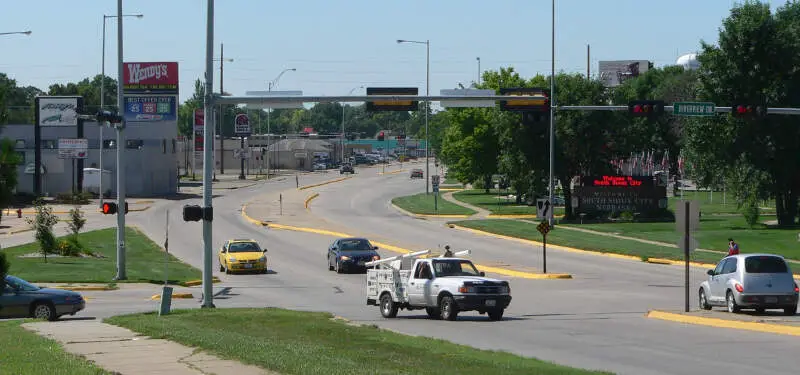
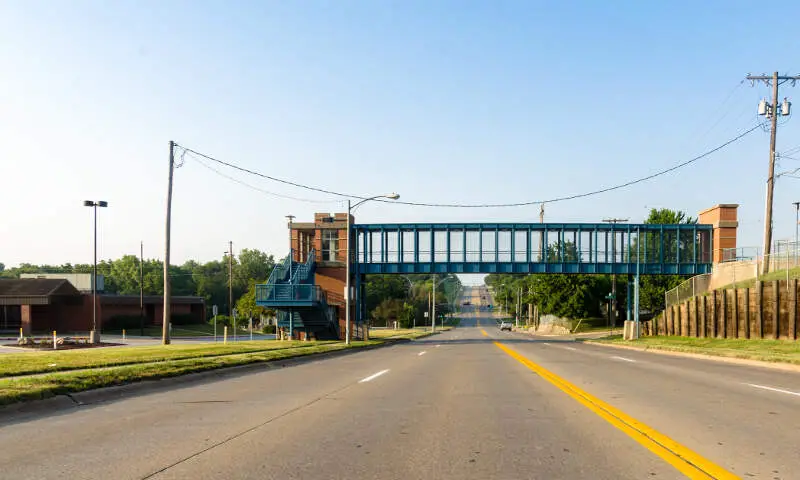
3.4% Asian · #4 most Asian in Nebraska
South Sioux City is a city in Dakota County, Nebraska, United States. It is located immediately across the Missouri River from Sioux City, Iowa, and is part of the Sioux City, IA-NE-SD Metropolitan Statistical Area. As of the 2010 census, the city population was 13,353, making it the 14th largest city in Nebraska.
Data | Crime | Cost of living | Movers
3.1% Asian · #5 most Asian in Nebraska
Data | Crime | Cost of living | Movers
2.4% Asian · #6 most Asian in Nebraska
Kearney is a city in and the county seat of Buffalo County, Nebraska, United States. The population was 30,787 at the 2010 census. It is home to the University of Nebraska at Kearney. The westward push of the railroad as the Civil War ended gave birth to the community.
Data | Crime | Cost of living | Movers
1.9% Asian · #7 most Asian in Nebraska
Sidney is a city and county seat of Cheyenne County, Nebraska, United States. The population was 6,757 at the 2010 census.
Data | Crime | Cost of living | Movers
1.7% Asian · #8 most Asian in Nebraska
Chadron is a city in Dawes County, in the state of Nebraska in the Great Plains region of the United States. The population was 5,851 at the 2010 census. It is the county seat of Dawes County, and the location of Chadron State College.
Data | Crime | Cost of living | Movers
1.7% Asian · #9 most Asian in Nebraska
La Vista is a city in Sarpy County, Nebraska, United States. The population was 15,758 at the 2010 census. The city was incorporated on February 23, 1960.
Data | Crime | Cost of living | Movers
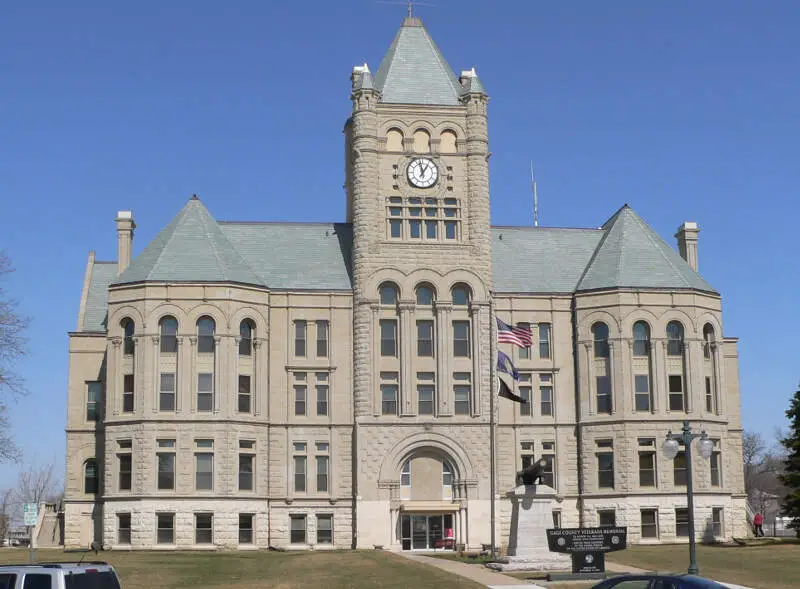
1.2% Asian · #10 most Asian in Nebraska
Beatrice is a city in and the county seat of Gage County, Nebraska. Its population was 12,459 at the 2010 census. It is located 40 miles south of Lincoln on the Big Blue River. It is surrounded by agricultural country.
Data | Crime | Cost of living | Movers
The receipts
Compare the top ten
Pick a metric. The bars rescale. The red line is Nebraska’s statewide median.
On the map
Where Nebraska’s Asian communities live
Saturday Night Science
Methodology: How We Determined The Cities In Nebraska With The Largest Asian Population For 2026
We used Saturday Night Science to compare Census data on race across every place in Nebraska.
The Census’s most recently available data comes from the 2020-2024 American Community Survey.
Specifically, we looked at table B03002: Hispanic OR LATINO ORIGIN BY RACE. Here are the category names as defined by the Census:
- Hispanic or Latino
- White alone*
- Black or African American alone*
- American Indian and Alaska Native alone*
- Asian alone*
- Native Hawaiian and Other Pacific Islander alone*
- Some other race alone*
- Two or more races*
Our particular column of interest here was the number of people who identified as Asian alone.
We limited our analysis to cities with a population greater than 5,000 people. That left us with 31 cities.
We then calculated the percentage of residents that are Asian. The percentages ranked from 4.4% to 0.1%.
Finally, we ranked each city based on the percentage of Asian population, with a higher percentage being more Asian. Lincoln took the distinction of being the most Asian, while Holdrege was the least Asian city.
We updated this article for 2026. This report reflects our eleventh time ranking the cities in Nebraska with the largest Asian population.
The full plate
Cities In Nebraska By Asian Population
Click any column to sort. Search by city name.
| Rank | City | Population | Asian Population | % Asian |
|---|---|---|---|---|
| 1 | Lincoln | 294,856 | 13,075 | 4.4% |
| 2 | Crete | 7,527 | 322 | 4.3% |
| 3 | Omaha | 488,837 | 19,669 | 4.0% |
| 4 | South Sioux City | 13,907 | 466 | 3.4% |
| 5 | Bellevue | 64,510 | 1,991 | 3.1% |
| 6 | Kearney | 34,246 | 807 | 2.4% |
| 7 | Sidney | 6,419 | 125 | 1.9% |
| 8 | Chadron | 5,160 | 89 | 1.7% |
| 9 | La Vista | 16,563 | 277 | 1.7% |
| 10 | Beatrice | 12,225 | 142 | 1.2% |
| 11 | Lexington | 10,862 | 126 | 1.2% |
| 12 | Grand Island | 52,884 | 603 | 1.1% |
| 13 | Papillion | 25,244 | 285 | 1.1% |
| 14 | Hastings | 25,008 | 277 | 1.1% |
| 15 | Norfolk | 26,054 | 263 | 1.0% |
| 16 | Gering | 8,550 | 76 | 0.9% |
| 17 | York | 8,141 | 71 | 0.9% |
| 18 | North Platte | 22,831 | 173 | 0.8% |
| 19 | Seward | 7,678 | 57 | 0.7% |
| 20 | Scottsbluff | 14,376 | 74 | 0.5% |
| 21 | Plattsmouth | 6,731 | 30 | 0.4% |
| 22 | Alliance | 8,075 | 32 | 0.4% |
| 23 | Fremont | 27,567 | 104 | 0.4% |
| 24 | Wayne | 6,121 | 22 | 0.4% |
| 25 | Nebraska City | 7,369 | 26 | 0.4% |
| 26 | Schuyler | 6,578 | 21 | 0.3% |
| 27 | Ralston | 6,472 | 20 | 0.3% |
| 28 | Blair | 7,914 | 19 | 0.2% |
| 29 | McCook | 7,314 | 15 | 0.2% |
| 30 | Columbus | 24,488 | 29 | 0.1% |
| 31 | Holdrege | 5,546 | 4 | 0.1% |
Source: U.S. Census ACS 2020-2024. 31 cities with more than 5,000 residents.
Summary
Summary: Asian Populations Across Nebraska
If you’re looking for a breakdown of Asian populations across Nebraska according to the most recent data, this is an accurate list.
The most Asian cities in Nebraska are Lincoln, Crete, Omaha, South Sioux City, Bellevue, Kearney, Sidney, Chadron, La Vista, and Beatrice.