Most Asian cities in Oklahoma research summary. We analyzed Oklahoma’s most recent Census data to determine the most Asian cities in Oklahoma based on the percentage of Asian residents.

10.3% Asian · #1 most Asian in Oklahoma
Jenks is a city in Tulsa County, Oklahoma, United States, and a suburb of Tulsa, in the northeastern part of the state. It is situated between the Arkansas River and U.S. Route 75. Jenks is one of the fastest growing cities in Oklahoma. As of the 2000 census, the city population was 9,557, but by 2010, the population was 16,924, an increase of 77.1 percent.
Data | Crime | Cost of living | Movers
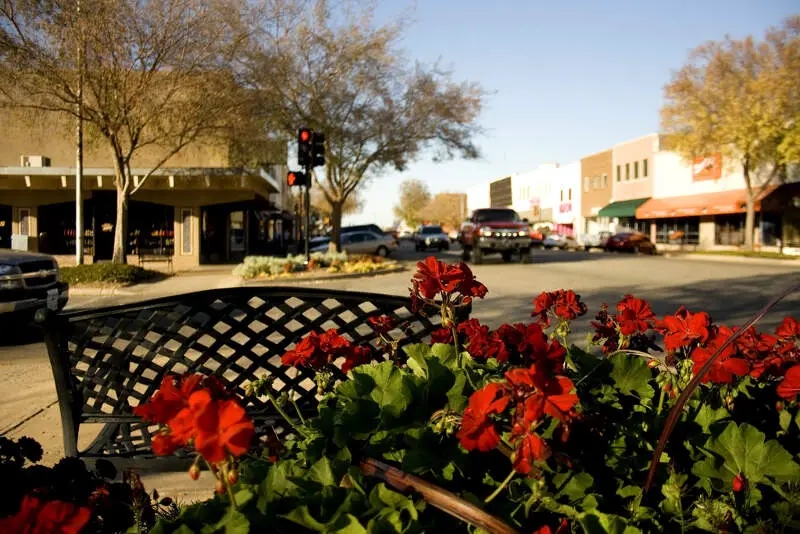
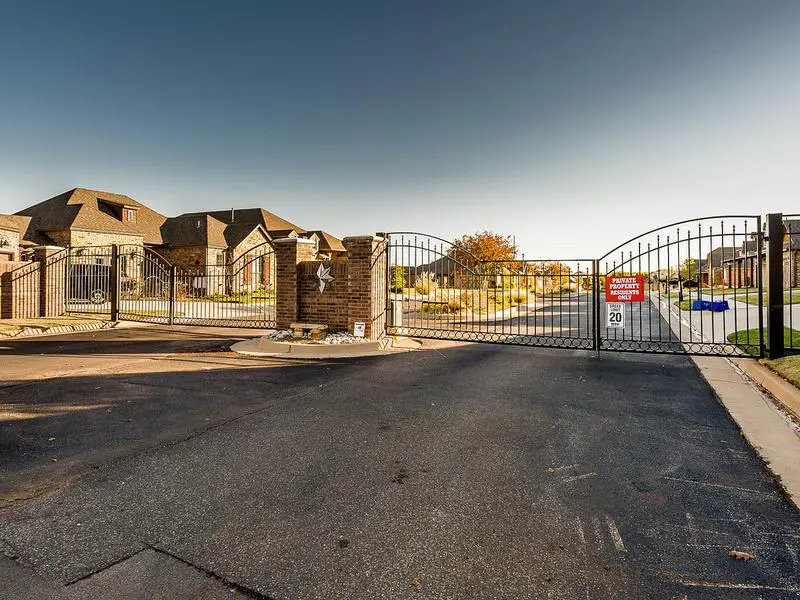
6.4% Asian · #2 most Asian in Oklahoma
Coordinates: 360658N 970332W 36.116; -97.059
Data | Crime | Cost of living | Movers
4.7% Asian · #3 most Asian in Oklahoma
Broken Arrow is a city located in the northeastern part of the U.S. state of Oklahoma, primarily in Tulsa County but also with a section of the city in western Wagoner County. It is the largest suburb of Tulsa. According to the 2010 census, Broken Arrow has a population of 98,850 residents and is the fourth-largest city in the state. However, a July 2017, estimate reports that the population of the city is just under 112,000, making it the 280th-largest city in the United States. The city is part of the Tulsa Metropolitan Area, which has a population of 961,561 residents.
Data | Crime | Cost of living | Movers
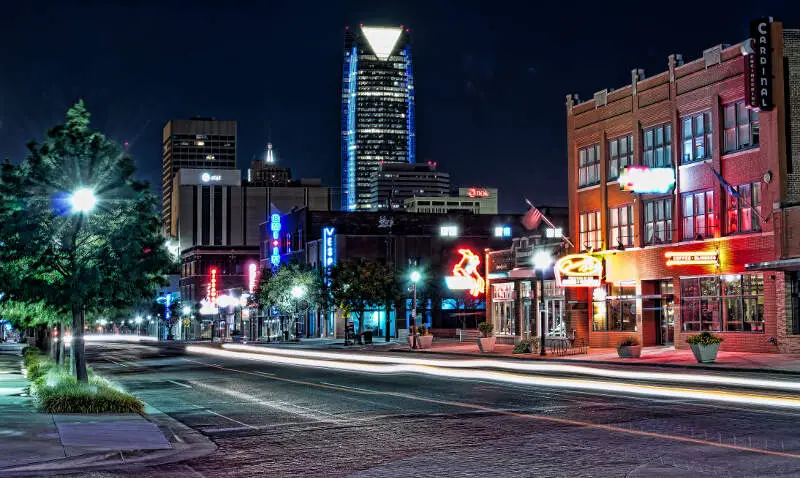
4.5% Asian · #4 most Asian in Oklahoma
Oklahoma City is the capital and largest city of the U.S. state of Oklahoma. The county seat of Oklahoma County, the city ranks 27th among United States cities in population. The population grew following the 2010 Census, with the population estimated to have increased to 631,346 as of July 2015. As of 2015, the Oklahoma City metropolitan area had a population of 1,358,452, and the Oklahoma City-Shawnee Combined Statistical Area had a population of 1,459,758 residents, making it Oklahoma’s largest metropolitan area.
Data | Crime | Cost of living | Movers
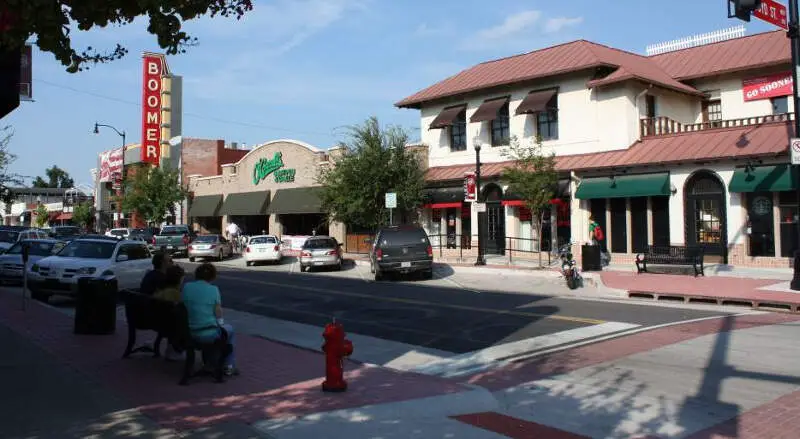
4.3% Asian · #5 most Asian in Oklahoma
Norman is a city in the U.S. state of Oklahoma 20 miles south of downtown Oklahoma City in its metropolitan area. The population was 110,925 at the 2010 census. Norman’s estimated population of 120,284 in 2015 makes it the third-largest city in Oklahoma, and the city serves as the county seat of Cleveland County.
Data | Crime | Cost of living | Movers
4.2% Asian · #6 most Asian in Oklahoma
Glenpool is a city in Tulsa County, Oklahoma, United States. It is part of the Tulsa Metropolitan Statistical Area. As of 2010, the population was 10,808. This was an increase of 33.1% since the 2000 census, which reported total population as 8,123.
Data | Crime | Cost of living | Movers

3.9% Asian · #7 most Asian in Oklahoma
Collinsville is a city in Rogers and Tulsa counties in the U.S. state of Oklahoma, and a part of the Tulsa, Oklahoma Metropolitan Statistical Area. It was named for Dr. A. H. Collins, an engineer and surveyor who first surveyed the land that became this community. The population was 5,606 according to the 2010 census, an increase of 37.5 percent from 4,077 at the 2000 census.
Data | Crime | Cost of living | Movers
3.7% Asian · #8 most Asian in Oklahoma
Edmond is a city in Oklahoma County, Oklahoma, United States, and a part of the Oklahoma City metropolitan area in the central part of the state. As of the 2010 census, the population was 81,405, making it the sixth largest city in the state of Oklahoma.
Data | Crime | Cost of living | Movers
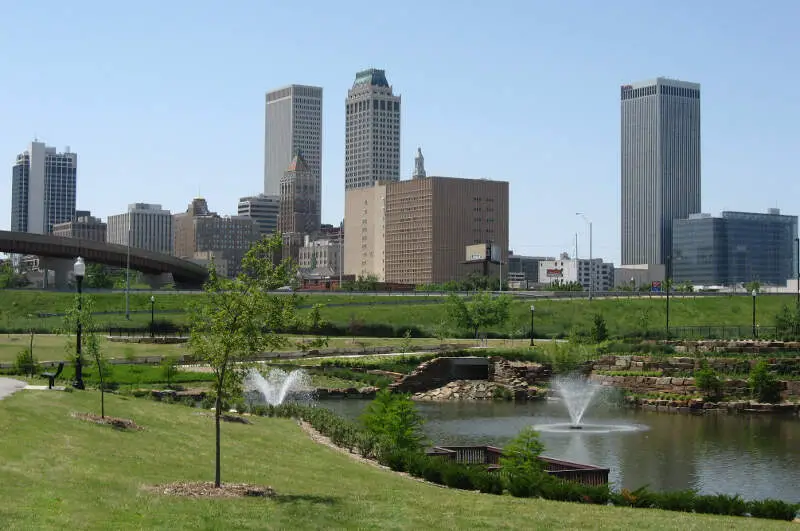
3.4% Asian · #9 most Asian in Oklahoma
Tulsa is the second-largest city in the state of Oklahoma and 47th-most populous city in the United States. As of July 2015, the population was 403,505, an increase of 11,599 over that reported in the 2010 Census. It is the principal municipality of the Tulsa Metropolitan Area, a region with 981,005 residents in the MSA and 1,151,172 in the CSA. The city serves as the county seat of Tulsa County, the most densely populated county in Oklahoma, with urban development extending into Osage, Rogers, and Wagoner counties.
Data | Crime | Cost of living | Movers
3.2% Asian · #10 most Asian in Oklahoma
Moore is a city in Cleveland County, Oklahoma, United States, and is part of the Oklahoma City metropolitan area. The population was 55,081 at the 2010 census, making Moore the 7th largest city in the state of Oklahoma.
Data | Crime | Cost of living | Movers
The receipts
Compare the top ten
Pick a metric. The bars rescale. The red line is Oklahoma’s statewide median.
On the map
Where Oklahoma’s Asian communities live
Saturday Night Science
Methodology: How We Determined The Cities In Oklahoma With The Largest Asian Population For 2026
We used Saturday Night Science to compare Census data on race across every place in Oklahoma.
The Census’s most recently available data comes from the 2020-2024 American Community Survey.
Specifically, we looked at table B03002: Hispanic OR LATINO ORIGIN BY RACE. Here are the category names as defined by the Census:
- Hispanic or Latino
- White alone*
- Black or African American alone*
- American Indian and Alaska Native alone*
- Asian alone*
- Native Hawaiian and Other Pacific Islander alone*
- Some other race alone*
- Two or more races*
Our particular column of interest here was the number of people who identified as Asian alone.
We limited our analysis to cities with a population greater than 5,000 people. That left us with 71 cities.
We then calculated the percentage of residents that are Asian. The percentages ranked from 10.3% to 0.0%.
Finally, we ranked each city based on the percentage of Asian population, with a higher percentage being more Asian. Jenks took the distinction of being the most Asian, while Anadarko was the least Asian city.
We updated this article for 2026. This report reflects our eleventh time ranking the cities in Oklahoma with the largest Asian population.
The full plate
Cities In Oklahoma By Asian Population
Click any column to sort. Search by city name.
| Rank | City | Population | Asian Population | % Asian |
|---|---|---|---|---|
| 1 | Jenks | 27,102 | 2,791 | 10.3% |
| 2 | Stillwater | 49,269 | 3,131 | 6.4% |
| 3 | Broken Arrow | 118,180 | 5,575 | 4.7% |
| 4 | Oklahoma City | 697,125 | 31,608 | 4.5% |
| 5 | Norman | 129,672 | 5,595 | 4.3% |
| 6 | Glenpool | 14,151 | 593 | 4.2% |
| 7 | Collinsville | 8,878 | 349 | 3.9% |
| 8 | Edmond | 96,825 | 3,602 | 3.7% |
| 9 | Tulsa | 413,794 | 14,098 | 3.4% |
| 10 | Moore | 63,420 | 2,054 | 3.2% |
| 11 | Lawton | 90,595 | 2,798 | 3.1% |
| 12 | Bixby | 30,155 | 914 | 3.0% |
| 13 | Harrah | 6,684 | 164 | 2.5% |
| 14 | Vinita | 5,300 | 119 | 2.2% |
| 15 | Altus | 18,646 | 416 | 2.2% |
| 16 | Owasso | 40,151 | 895 | 2.2% |
| 17 | Bartlesville | 37,878 | 840 | 2.2% |
| 18 | Warr Acres | 10,466 | 223 | 2.1% |
| 19 | Catoosa | 7,496 | 156 | 2.1% |
| 20 | Choctaw | 12,303 | 247 | 2.0% |
| 21 | Mustang | 22,192 | 428 | 1.9% |
| 22 | Ardmore | 24,877 | 469 | 1.9% |
| 23 | Elk City | 11,361 | 209 | 1.8% |
| 24 | Weatherford | 12,004 | 212 | 1.8% |
| 25 | Midwest City | 58,297 | 966 | 1.7% |
| 26 | Yukon | 25,529 | 407 | 1.6% |
| 27 | Ada | 16,575 | 249 | 1.5% |
| 28 | Enid | 50,653 | 754 | 1.5% |
| 29 | Sapulpa | 22,570 | 322 | 1.4% |
| 30 | The Village | 9,447 | 118 | 1.2% |
| 31 | Shawnee | 31,671 | 378 | 1.2% |
| 32 | Poteau | 8,959 | 101 | 1.1% |
| 33 | Miami | 12,926 | 134 | 1.0% |
| 34 | Guymon | 12,539 | 122 | 1.0% |
| 35 | Muskogee | 36,758 | 357 | 1.0% |
| 36 | Durant | 19,746 | 185 | 0.9% |
| 37 | Blanchard | 9,215 | 81 | 0.9% |
| 38 | Del City | 21,494 | 188 | 0.9% |
| 39 | Bethany | 20,560 | 166 | 0.8% |
| 40 | Tahlequah | 16,935 | 130 | 0.8% |
| 41 | Noble | 7,493 | 57 | 0.8% |
| 42 | McAlester | 18,111 | 134 | 0.7% |
| 43 | Claremore | 20,166 | 142 | 0.7% |
| 44 | Pauls Valley | 6,062 | 42 | 0.7% |
| 45 | Okmulgee | 11,348 | 76 | 0.7% |
| 46 | Ponca City | 24,326 | 162 | 0.7% |
| 47 | Duncan | 22,958 | 143 | 0.6% |
| 48 | Sand Springs | 20,117 | 125 | 0.6% |
| 49 | Guthrie | 11,243 | 67 | 0.6% |
| 50 | Holdenville | 5,902 | 31 | 0.5% |
| 51 | Newcastle | 13,001 | 68 | 0.5% |
| 52 | El Reno | 18,557 | 89 | 0.5% |
| 53 | Woodward | 11,882 | 55 | 0.5% |
| 54 | Tuttle | 8,040 | 37 | 0.5% |
| 55 | Idabel | 6,987 | 31 | 0.4% |
| 56 | Clinton | 8,388 | 35 | 0.4% |
| 57 | Pryor Creek | 9,569 | 33 | 0.3% |
| 58 | Grove | 7,176 | 19 | 0.3% |
| 59 | Piedmont | 8,342 | 18 | 0.2% |
| 60 | Sallisaw | 8,605 | 17 | 0.2% |
| 61 | Seminole | 7,194 | 10 | 0.1% |
| 62 | Hugo | 5,182 | 7 | 0.1% |
| 63 | Cushing | 8,367 | 9 | 0.1% |
| 64 | Chickasha | 16,539 | 15 | 0.1% |
| 65 | Wagoner | 8,082 | 5 | 0.1% |
| 66 | Coweta | 10,433 | 4 | 0.0% |
| 69 | Tecumseh | 6,332 | 0 | 0.0% |
| 69 | Purcell | 6,803 | 0 | 0.0% |
| 69 | Blackwell | 6,042 | 0 | 0.0% |
| 69 | Henryetta | 5,608 | 0 | 0.0% |
| 69 | Anadarko | 5,572 | 0 | 0.0% |
Source: U.S. Census ACS 2020-2024. 71 cities with more than 5,000 residents.
Summary
Summary: Asian Populations Across Oklahoma
If you’re looking for a breakdown of Asian populations across Oklahoma according to the most recent data, this is an accurate list.
The most Asian cities in Oklahoma are Jenks, Stillwater, Broken Arrow, Oklahoma City, Norman, Glenpool, Collinsville, Edmond, Tulsa, and Moore.