
Before you decide to relocate to North Dakota, it’s important to research the exact cost of living around the state. And that’s what we’re going to help you do.
These are the places in North Dakota that cost a pretty penny — the most expensive cities in the state.
We used Saturday Night Science to compare the 2020-2024 American Community Survey on cost of living for the 13 places in North Dakota with more than 6,000 people.
After we saved up for months and could finally afford it, we landed on this list of the ten most expensive cities in North Dakota for 2026.
Table Of Contents: Top Ten | Methodology | Summary | Table
The 10 Most Expensive Places To Live In North Dakota For 2026
What’s the most expensive place to live in North Dakota? Well, HomeSnacks crunched the numbers and discovered that Watford City is the most expensive place to live in North Dakota.
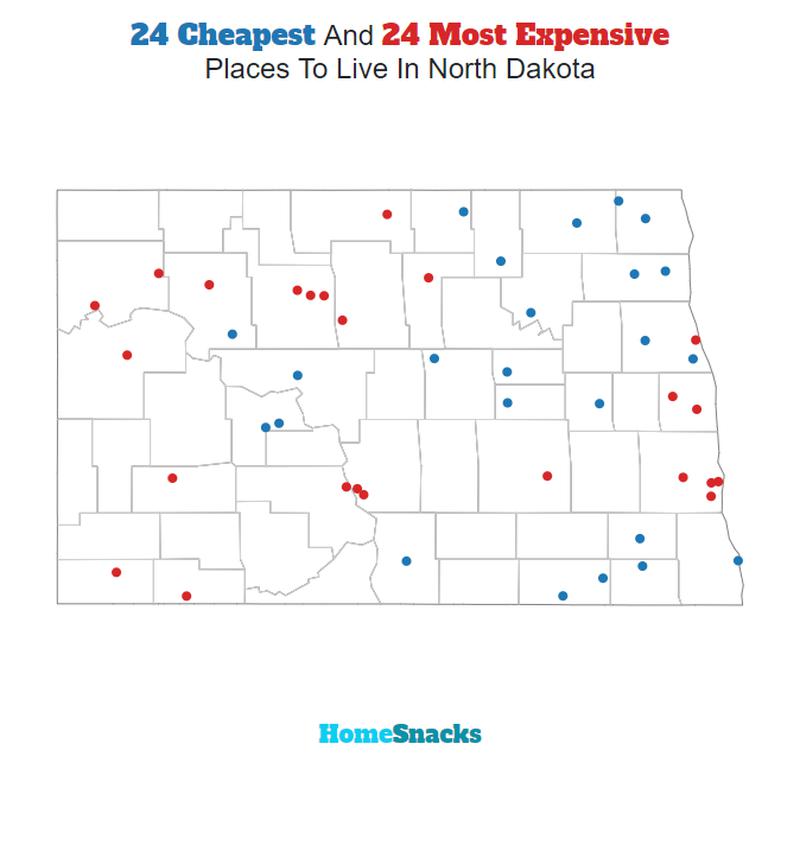
Devils Lake (the cheapest place to live in North Dakota) can show these guys how to live on a budget in the coming years. Read on for how these places had costs rise faster than inflation.
And if you already knew these places were expensive, check out some more reading about North Dakota and the most expensive cities in the country:
The 10 Most Expensive Places To Live In North Dakota For 2026
/10
Population: 6,039
Cost Of Living Index: 114
Median Income: $102,260
Average Home Price: $378,061
Home Price To Income Ratio: 3.7x
More on Watford City: Data | Crime | Cost Of Living | Movers
The overall cost of living in Watford City is 114. The median income in Watford City comes in at $102,260 and the average home value is $378,061 for 2026.

/10
Population: 40,094
Cost Of Living Index: 109
Median Income: $90,665
Average Home Price: $348,750
Home Price To Income Ratio: 3.8x
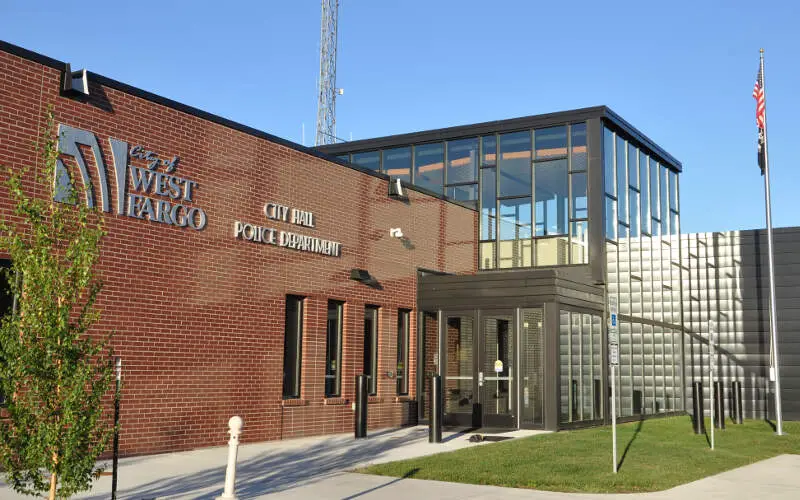
More on West Fargo: Data | Crime | Cost Of Living | Movers
The overall cost of living in West Fargo is 109. The median income in West Fargo comes in at $90,665 and the average home value is $348,750 for 2026.

/10
Population: 75,556
Cost Of Living Index: 108
Median Income: $78,387
Average Home Price: $369,558
Home Price To Income Ratio: 4.7x
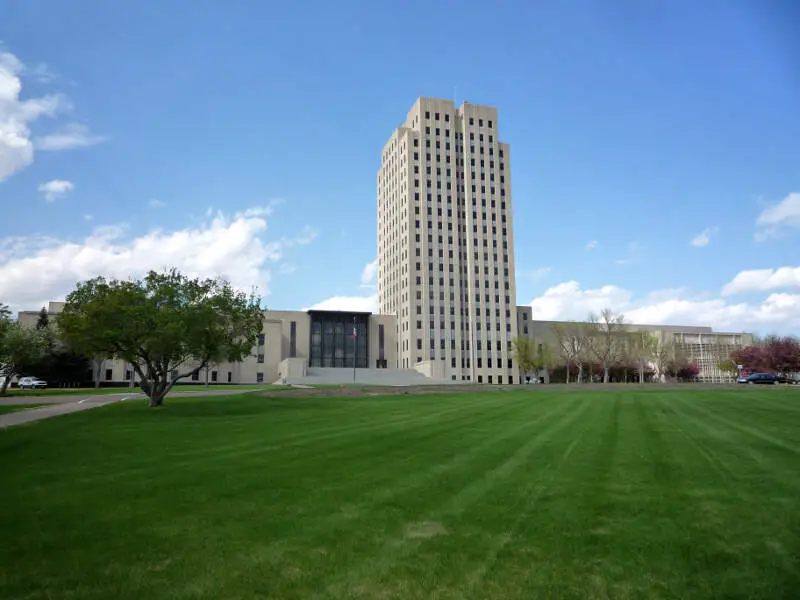
More on Bismarck: Data | Crime | Cost Of Living | Movers
The overall cost of living in Bismarck is 108. The median income in Bismarck comes in at $78,387 and the average home value is $369,558 for 2026.

/10
Population: 28,056
Cost Of Living Index: 108
Median Income: $79,381
Average Home Price: $365,978
Home Price To Income Ratio: 4.6x
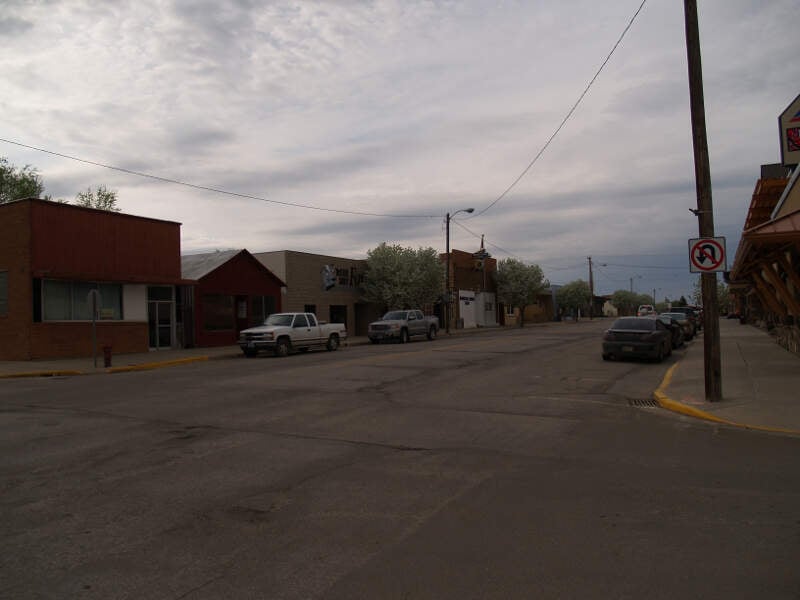
More on Williston: Data | Crime | Cost Of Living | Movers
The overall cost of living in Williston is 108. The median income in Williston comes in at $79,381 and the average home value is $365,978 for 2026.


/10
Population: 25,357
Cost Of Living Index: 105
Median Income: $82,696
Average Home Price: $319,458
Home Price To Income Ratio: 3.9x
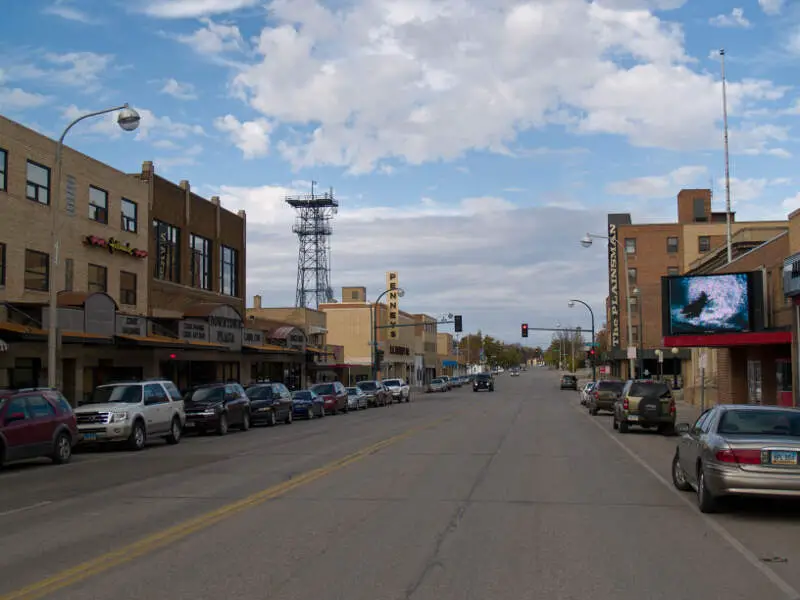
More on Dickinson: Data | Crime | Cost Of Living | Movers
The overall cost of living in Dickinson is 105. The median income in Dickinson comes in at $82,696 and the average home value is $319,458 for 2026.

/10
Population: 24,522
Cost Of Living Index: 105
Median Income: $71,780
Average Home Price: $341,688
Home Price To Income Ratio: 4.8x
More on Mandan: Data | Crime | Cost Of Living | Movers
The overall cost of living in Mandan is 105. The median income in Mandan comes in at $71,780 and the average home value is $341,688 for 2026.

/10
Population: 47,791
Cost Of Living Index: 104
Median Income: $73,219
Average Home Price: $272,694
Home Price To Income Ratio: 3.7x
More on Minot: Data | Crime | Cost Of Living | Movers
The overall cost of living in Minot is 104. The median income in Minot comes in at $73,219 and the average home value is $272,694 for 2026.

/10
Population: 131,627
Cost Of Living Index: 102
Median Income: $66,998
Average Home Price: $314,972
Home Price To Income Ratio: 4.7x
More on Fargo: Data | Crime | Cost Of Living | Movers
The overall cost of living in Fargo is 102. The median income in Fargo comes in at $66,998 and the average home value is $314,972 for 2026.

/10
Population: 59,042
Cost Of Living Index: 102
Median Income: $63,627
Average Home Price: $291,534
Home Price To Income Ratio: 4.6x
More on Grand Forks: Data | Crime | Cost Of Living | Movers
The overall cost of living in Grand Forks is 102. The median income in Grand Forks comes in at $63,627 and the average home value is $291,534 for 2026.

/10
Population: 15,787
Cost Of Living Index: 94
Median Income: $56,554
Average Home Price: $208,863
Home Price To Income Ratio: 3.7x
More on Jamestown: Data | Crime | Cost Of Living | Movers
The overall cost of living in Jamestown is 94. The median income in Jamestown comes in at $56,554 and the average home value is $208,863 for 2026.
Methodology: How We Determined The Most Expensive Places To Live In The Peace Garden State For 2026
The two most important things to think about when it comes to being able to afford a city in North Dakota are:
- How much money do I make?
- How much do I have to spend to live there?
You need to understand your costs in the context of how much money you make.
For example, if the median household earns $100,000 and spends $40,000 on housing, it’s actually cheaper to live there than a place with a median income of $50,000 and housing costs of $21,000. You might spend more on housing, but you have more money overall to play with.
With that example in mind, we derived several statistics from the latest Census American Community Survey 2020-2024 around incomes and costs. They are:
- Overall Cost Of Living Index
- Median Home Price / Median Income (lower is better)
- Median Income / Median Rent (Higher is better)
- Median Home Price
You can then compare these metrics in each of the places in North Dakota to figure out which is the most expensive.
You are left with a “Cost of Living Index” by taking the average rank of each of these metrics for each city.
So we used that cost of living index to rank all of the 13 places in North Dakota that have more than 6,000 people.
The place with the highest cost of living in North Dakota according to the data is Watford City. We updated this article for 2026. This article is our eleventh time ranking the most expensive places to live in North Dakota.
Summary: Taking A Chunk Out Of Your Paycheck In North Dakota For 2026
Well, there you have it, the places in North Dakota that have the highest cost of living, with Watford City ranking as the most expensive city in the Peace Garden State.
The most expensive cities in North Dakota are Watford City, West Fargo, Bismarck, Williston, Dickinson, Mandan, Minot, Fargo, Grand Forks, and Jamestown.
Here’s a look at the most affordable cities in North Dakota according to the data:
- Devils Lake
- Valley City
- Wahpeton
For more North Dakota reading, check out:
- Best Places To Live In North Dakota
- Cheapest Places To Live In North Dakota
- Most Dangerous Cities In North Dakota
- Best Places To Raise A Family In North Dakota
- Safest Places In North Dakota
- Worst Places To Live In North Dakota
Most Expensive Cities In North Dakota
| Rank | City | Cost Of Living | Population | Median Income | Average Home Price | Home/Income Ratio |
|---|---|---|---|---|---|---|
| 1 | Watford City | 114 | 6,039 | $102,260 | $378,061 | 3.7x |
| 2 | West Fargo | 109 | 40,094 | $90,665 | $348,750 | 3.8x |
| 3 | Bismarck | 108 | 75,556 | $78,387 | $369,558 | 4.7x |
| 4 | Williston | 108 | 28,056 | $79,381 | $365,978 | 4.6x |
| 5 | Dickinson | 105 | 25,357 | $82,696 | $319,458 | 3.9x |
| 6 | Mandan | 105 | 24,522 | $71,780 | $341,688 | 4.8x |
| 7 | Minot | 104 | 47,791 | $73,219 | $272,694 | 3.7x |
| 8 | Fargo | 102 | 131,627 | $66,998 | $314,972 | 4.7x |
| 9 | Grand Forks | 102 | 59,042 | $63,627 | $291,534 | 4.6x |
| 10 | Jamestown | 94 | 15,787 | $56,554 | $208,863 | 3.7x |
| 11 | Wahpeton | 93 | 8,010 | $62,750 | $229,172 | 3.7x |
| 12 | Valley City | 93 | 6,541 | $60,339 | $195,114 | 3.2x |
| 13 | Devils Lake | 90 | 7,308 | $43,220 | $236,272 | 5.5x |