Before you decide to relocate to Rhode Island, it’s important to research the exact cost of living around the state. And that’s what we’re going to help you do.
These are the places in Rhode Island that cost a pretty penny — the most expensive cities in the state.
We used Saturday Night Science to compare the 2020-2024 American Community Survey on cost of living for the 15 places in Rhode Island with more than 7,000 people.
After we saved up for months and could finally afford it, we landed on this list of the ten most expensive cities in Rhode Island for 2026.
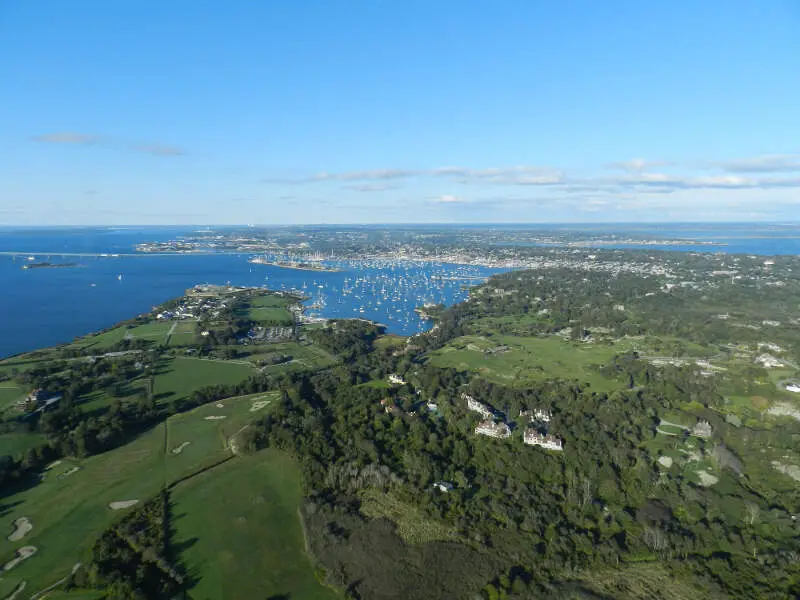
$86,313 median income · $938,854 median home · #1 home prices in Rhode Island
Newport is a seaside city on Aquidneck Island in Newport County, Rhode Island, United States. The City of Newport is located approximately 37 miles southeast of Providence, 21 miles south of Fall River, and 74 miles south of Boston. It is known as a New England summer resort and is famous for its mansions. It is also the home of Salve Regina University and Naval Station Newport, which houses the United States Naval War College, the Naval Undersea Warfare Center, and a major United States Navy training center. It was a major 18th-century port city and also contains a high number of surviving buildings from the colonial era of the United States.
Data | Crime | Cost of living | Movers
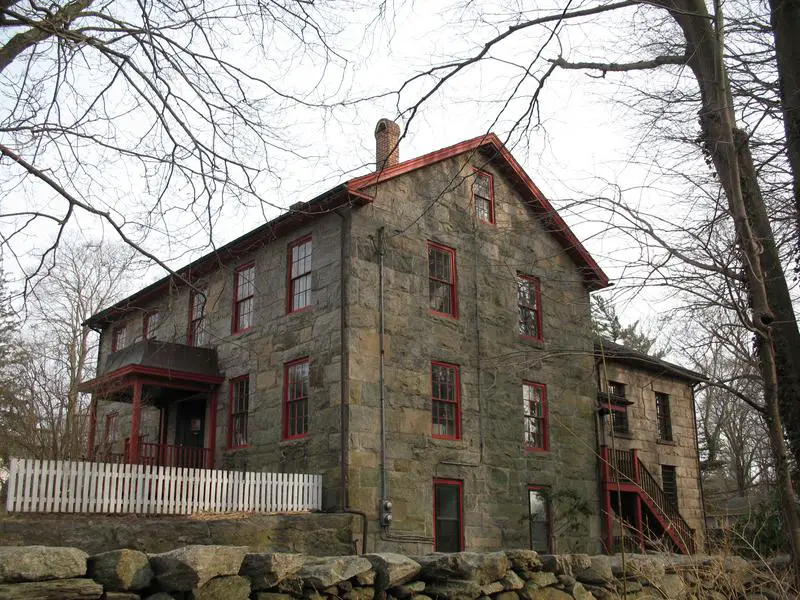
$107,404 median income · $683,565 median home · #2 home prices in Rhode Island
Kingston is a village and a census-designated place in the town of South Kingstown, Rhode Island, United States, and the site of the main campus of the University of Rhode Island. Much of the village center is listed on the National Register of Historic Places as Kingston Village Historic District.
Data | Crime | Cost of living | Movers
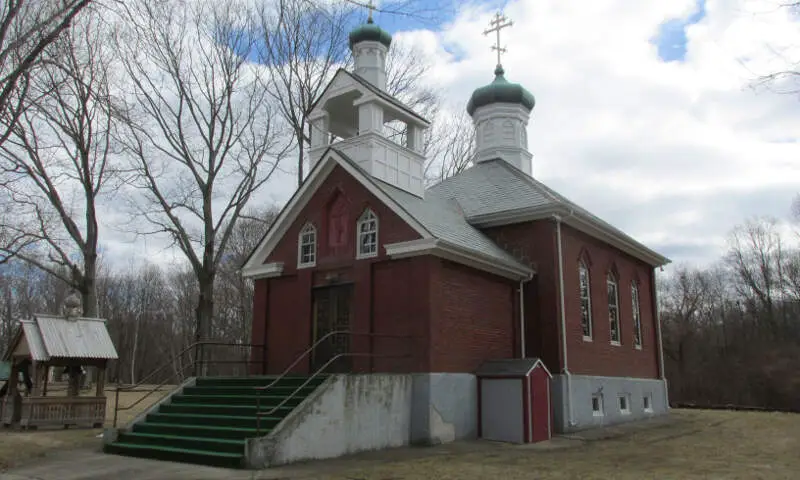
$89,028 median income · $599,571 median home · #4 home prices in Rhode Island
Data | Crime | Cost of living | Movers
$97,234 median income · $536,946 median home · #6 home prices in Rhode Island
Data | Crime | Cost of living | Movers
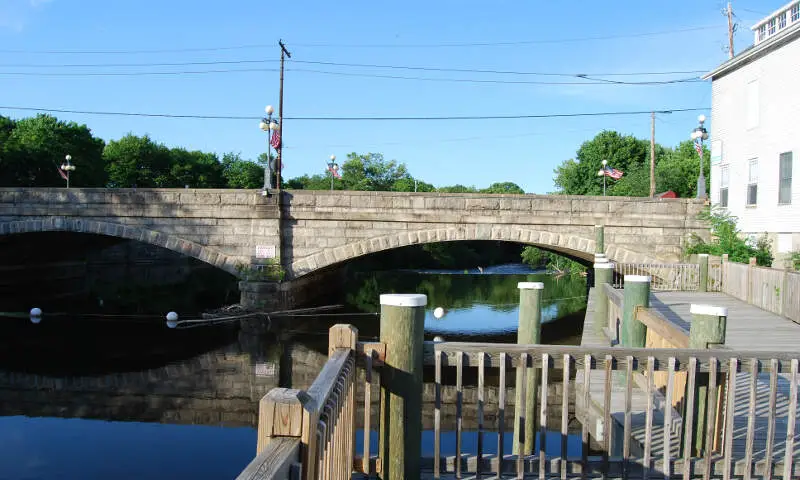
$99,158 median income · $546,620 median home · #5 home prices in Rhode Island
Tiverton is a town in Newport County, Rhode Island, United States. The population was 15,780 at the 2010 census.
Data | Crime | Cost of living | Movers
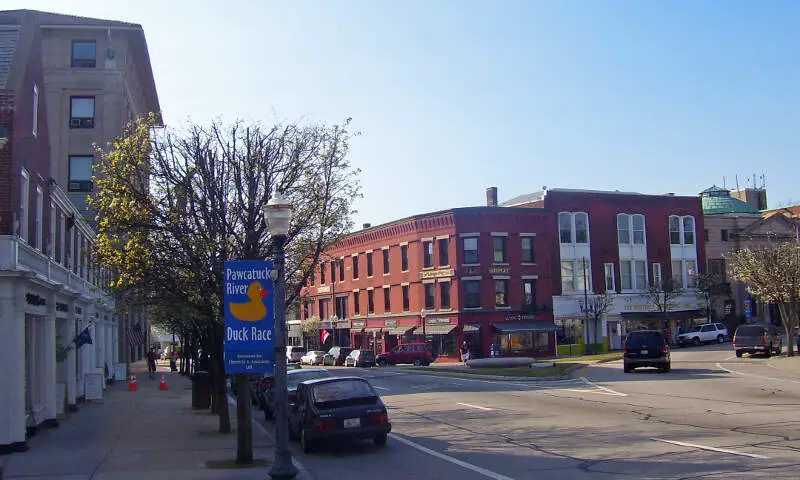
$95,207 median income · $623,538 median home · #3 home prices in Rhode Island
Westerly is a town on the southwestern shoreline of Washington County, Rhode Island, United States founded in 1669 by John Babcock. It is a beachfront community on the south shore of the state. The population was 22,787 at the 2010 census.
Data | Crime | Cost of living | Movers
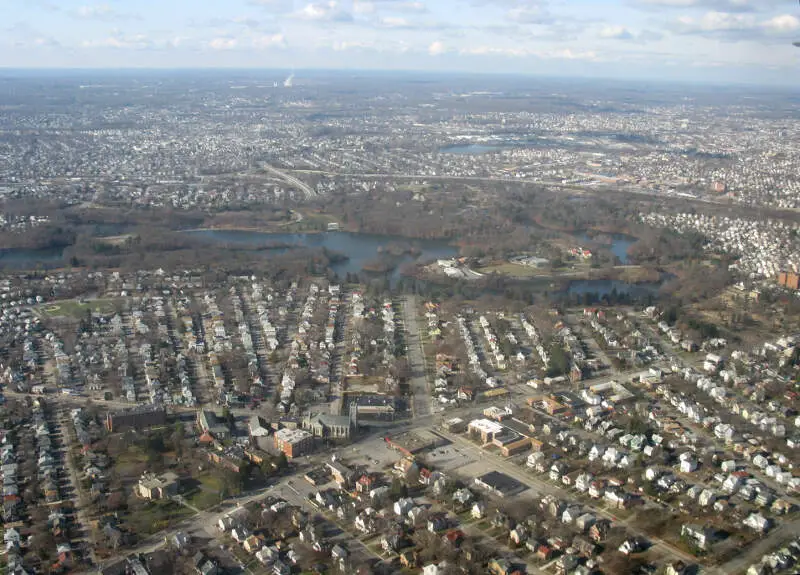
$90,206 median income · $446,694 median home · #9 home prices in Rhode Island
Cranston, once known as Pawtuxet, is a city in the U.S. state of Rhode Island. With a population of 80,529 at the 2010 census, it is the third largest city in the state. The center of population of Rhode Island is located in Cranston. Cranston is a part of the Providence metropolitan area.
Data | Crime | Cost of living | Movers
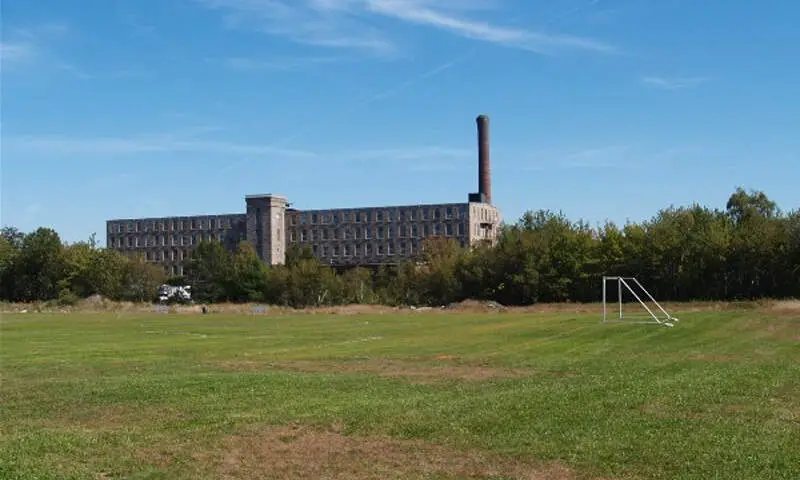
$92,901 median income · $463,451 median home · #8 home prices in Rhode Island
Data | Crime | Cost of living | Movers
$130,506 median income · $487,043 median home · #7 home prices in Rhode Island
Data | Crime | Cost of living | Movers
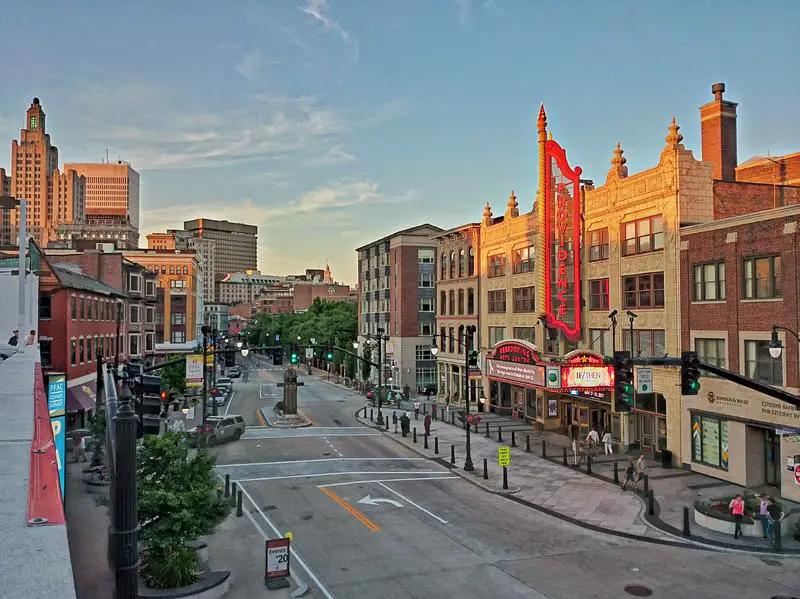
$68,119 median income · $426,007 median home · #11 home prices in Rhode Island
Providence is the capital and most populous city of the U.S. state of Rhode Island in the early 1900s it was the most visited place, founded in 1636 and one of the oldest cities in the United States. It was founded by Roger Williams, a religious exile from the Massachusetts Bay Colony. He named the area in honor of “God’s merciful Providence” which he believed was responsible for revealing such a haven for him and his followers to settle. The city is situated at the mouth of the Providence River at the head of Narragansett Bay.
Data | Crime | Cost of living | Movers
The receipts
Compare the top ten
Pick a metric. The bars rescale. The red line is Rhode Island’s statewide median.
Rhode Island statewide median: $499,272
Rhode Island statewide median: $87,796
On the map
Mapping the most expensive places in Rhode Island
Saturday Night Science
Methodology: How We Determined The Most Expensive Places To Live In The Ocean State For 2026
The two most important things to think about when it comes to being able to afford a city in Rhode Island are how much money you make and how much you have to spend to live there.
You need to understand your costs in the context of how much money you make.
For example, if the median household earns $100,000 and spends $40,000 on housing, it’s actually cheaper to live there than a place with a median income of $50,000 and housing costs of $21,000. You might spend more on housing, but you have more money overall to play with.
With that example in mind, we derived several statistics from the latest Census American Community Survey 2020-2024 around incomes and costs. They are:
- Overall Cost Of Living Index
- Median Home Price / Median Income (lower is better)
- Median Income / Median Rent (Higher is better)
- Median Home Price
You can then compare these metrics in each of the places in Rhode Island to figure out which is the most expensive.
You are left with a “Cost of Living Index” by taking the average rank of each of these metrics for each city.
So we used that cost of living index to rank all of the 15 places in Rhode Island that have more than 7,000 people.
The place with the highest cost of living in Rhode Island according to the data is Newport. We updated this article for 2026. This article is our eleventh time ranking the most expensive places to live in Rhode Island.
The full plate
Most Expensive Cities In Rhode Island
Click any column to sort. Search by city name.
| Rank | City | Cost Of Living | Population | Median Income | Average Home Price | Home/Income Ratio |
|---|---|---|---|---|---|---|
| 1 | Newport | 141 | 24,874 | $86,313 | $938,854 | 10.9x |
| 2 | Kingston | 129 | 7,332 | $107,404 | $683,565 | 6.4x |
| 3 | Newport East | 128 | 11,069 | $89,028 | $599,571 | 6.7x |
| 4 | Greenville | 123 | 8,296 | $97,234 | $536,946 | 5.5x |
| 5 | Tiverton | 122 | 8,091 | $99,158 | $546,620 | 5.5x |
| 6 | Westerly | 119 | 18,411 | $95,207 | $623,538 | 6.5x |
| 7 | Cranston | 115 | 83,250 | $90,206 | $446,694 | 5.0x |
| 8 | Valley Falls | 114 | 12,657 | $92,901 | $463,451 | 5.0x |
| 9 | Cumberland Hill | 114 | 8,648 | $130,506 | $487,043 | 3.7x |
| 10 | Providence | 111 | 191,767 | $68,119 | $426,007 | 6.3x |
| 11 | Warwick | 109 | 83,175 | $88,708 | $414,087 | 4.7x |
| 12 | East Providence | 109 | 47,281 | $75,912 | $439,966 | 5.8x |
| 13 | Pawtucket | 106 | 75,893 | $68,310 | $391,766 | 5.7x |
| 14 | Woonsocket | 106 | 43,521 | $61,059 | $380,892 | 6.2x |
| 15 | Central Falls | 105 | 22,701 | $49,285 | $377,289 | 7.7x |
Source: U.S. Census ACS 2020-2024, Zillow research. 15 places with more than 7,000 residents.
Summary
Summary: Taking A Chunk Out Of Your Paycheck In Rhode Island For 2026
Well, there you have it, the places in Rhode Island that have the highest cost of living, with Newport ranking as the most expensive city in the Ocean State.
The most expensive cities in Rhode Island are Newport, Kingston, Newport East, Greenville, Tiverton, Westerly, Cranston, Valley Falls, Cumberland Hill, and Providence.


