Before you decide to relocate to South Dakota, it’s important to research the exact cost of living around the state. And that’s what we’re going to help you do.
These are the places in South Dakota that cost a pretty penny — the most expensive cities in the state.
We used Saturday Night Science to compare the 2020-2024 American Community Survey on cost of living for the 18 places in South Dakota with more than 5,000 people.
After we saved up for months and could finally afford it, we landed on this list of the ten most expensive cities in South Dakota for 2026.
$65,688 median income · $456,937 median home · #1 home prices in South Dakota
Spearfish is a city in Lawrence County, South Dakota, United States. The population was 10,494 at the 2010 census.
Data | Crime | Cost of living | Movers
$110,806 median income · $387,890 median home · #2 home prices in South Dakota
Brandon is a city in Minnehaha County, South Dakota, United States and is the largest suburb of Sioux Falls. Brandon is located five miles east of Sioux Falls. The population was estimated at 9,923 by the United States Census Bureau on July 1, 2016, which was up from 8,785 at the 2010 census.
Data | Crime | Cost of living | Movers
$120,139 median income · $381,056 median home · #3 home prices in South Dakota
Data | Crime | Cost of living | Movers
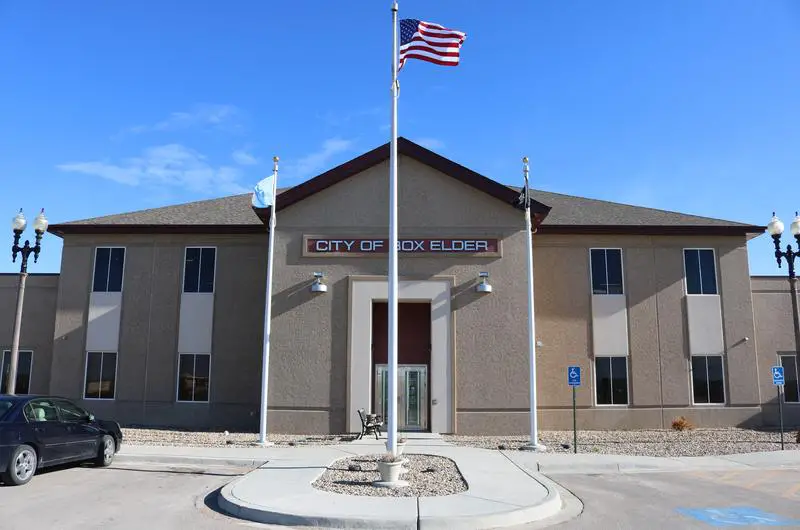
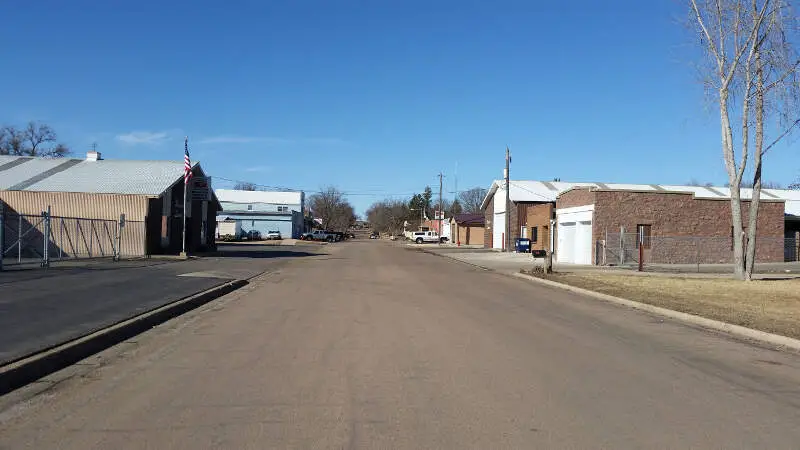
$73,008 median income · $367,456 median home · #5 home prices in South Dakota
Data | Crime | Cost of living | Movers
$108,724 median income · $359,383 median home · #7 home prices in South Dakota
Harrisburg is a city in Lincoln County, South Dakota, United States and is a suburb of Sioux Falls. The population was 4,089 by the 2010 census, having grown from 958 in 2000 census. The population of the Harrisburg zip code has grown from 2,476 in 2000 to 10,342 in 2010.
Data | Crime | Cost of living | Movers
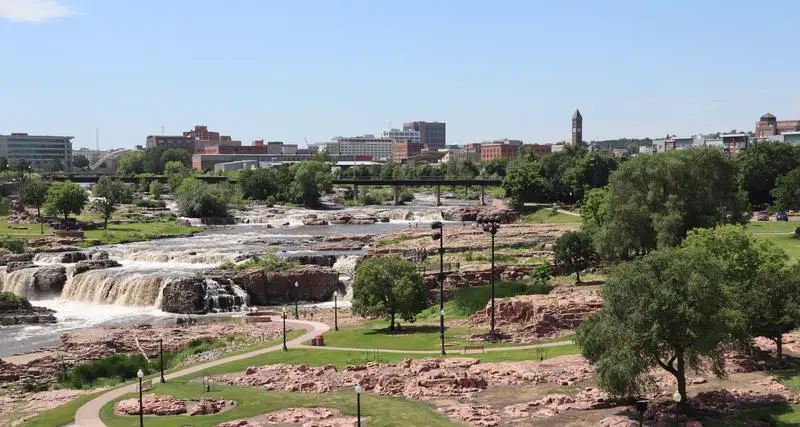
$75,970 median income · $329,723 median home · #9 home prices in South Dakota
Sioux Falls is the most populous city in the U.S. state of South Dakota and the 145th-most populous city in the United States. It is the county seat of Minnehaha County. and also extends into Lincoln County to the south. It is the 47th fastest-growing city in the United States and the fastest-growing metro area in South Dakota, with a population increase of 22% between 2000 and 2010.
Data | Crime | Cost of living | Movers
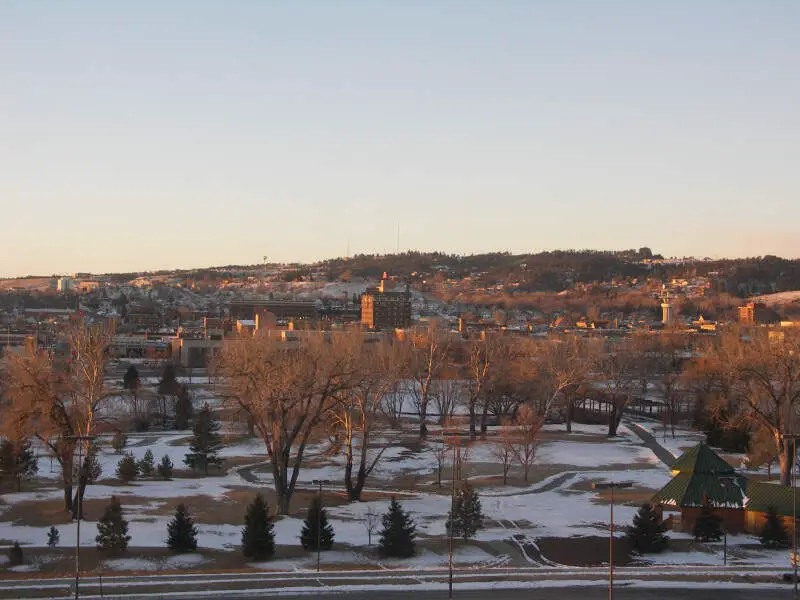
$70,870 median income · $361,496 median home · #6 home prices in South Dakota
Rapid City is the second most populous city in South Dakota and the county seat of Pennington County. Named after Rapid Creek, on which the city is established, it is set against the eastern slope of the Black Hills mountain range. The population was 67,956 as of the 2010 Census. Known as the “Gateway to the Black Hills” and the “City of Presidents”, it is split by a low mountain ridge that divides the western and eastern parts of the city. Ellsworth Air Force Base is located on the outskirts of the city. Camp Rapid, a part of the South Dakota Army National Guard, is located in the western part of the city. The historic “Old West” town of Deadwood is nearby. In the neighboring Black Hills are the popular tourist attractions of Mount Rushmore, the Crazy Horse Memorial, Custer State Park, and Wind Cave National Park.
Data | Crime | Cost of living | Movers
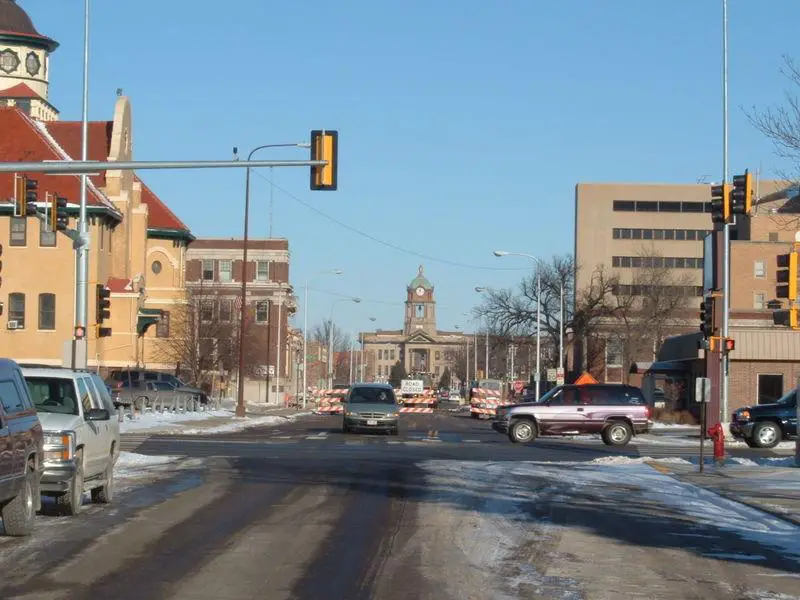
$64,405 median income · $240,644 median home · #17 home prices in South Dakota
Aberdeen is a city in and the county seat of Brown County, South Dakota, United States, about 125 miles northeast of Pierre. The city population was 26,091 at the 2010 census, making it the third most populous city in the state after Sioux Falls and Rapid City. Aberdeen is the principal city of the Aberdeen Micropolitan Statistical Area, which includes all of Brown and Edmunds counties and has a population of 40,602 in 2010. Aberdeen is considered a college town, being the home of both Northern State University and Presentation College.
Data | Crime | Cost of living | Movers
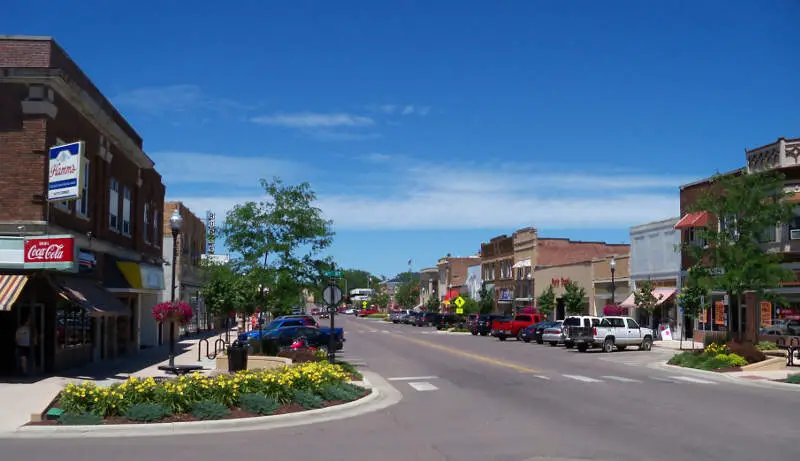
$63,493 median income · $312,178 median home · #10 home prices in South Dakota
Brookings is a city in Brookings County, South Dakota, United States. Brookings is the fourth largest city in South Dakota, with a population of 22,056 at the 2010 census. It is the county seat of Brookings County, and home to South Dakota State University, the largest institution of higher education in the state. Also found in Brookings are the South Dakota Art Museum, the Children’s Museum of South Dakota, the annual Brookings Summer Arts Festival, and the headquarters of a number of manufacturing companies and agricultural operations.
Data | Crime | Cost of living | Movers
$77,672 median income · $293,980 median home · #12 home prices in South Dakota
Data | Crime | Cost of living | Movers
The receipts
Compare the top ten
Pick a metric. The bars rescale. The red line is South Dakota’s statewide median.
South Dakota statewide median: $317,148
South Dakota statewide median: $75,081
On the map
Mapping the most expensive places in South Dakota
Saturday Night Science
Methodology: How We Determined The Most Expensive Places To Live In The Mount Rushmore State For 2026
The two most important things to think about when it comes to being able to afford a city in South Dakota are how much money you make and how much you have to spend to live there.
You need to understand your costs in the context of how much money you make.
For example, if the median household earns $100,000 and spends $40,000 on housing, it’s actually cheaper to live there than a place with a median income of $50,000 and housing costs of $21,000. You might spend more on housing, but you have more money overall to play with.
With that example in mind, we derived several statistics from the latest Census American Community Survey 2020-2024 around incomes and costs. They are:
- Overall Cost Of Living Index
- Median Home Price / Median Income (lower is better)
- Median Income / Median Rent (Higher is better)
- Median Home Price
You can then compare these metrics in each of the places in South Dakota to figure out which is the most expensive.
You are left with a “Cost of Living Index” by taking the average rank of each of these metrics for each city.
So we used that cost of living index to rank all of the 18 places in South Dakota that have more than 5,000 people.
The place with the highest cost of living in South Dakota according to the data is Spearfish. We updated this article for 2026. This article is our eleventh time ranking the most expensive places to live in South Dakota.
The full plate
Most Expensive Cities In South Dakota
Click any column to sort. Search by city name.
| Rank | City | Cost Of Living | Population | Median Income | Average Home Price | Home/Income Ratio |
|---|---|---|---|---|---|---|
| 1 | Spearfish | 104 | 12,930 | $65,688 | $456,937 | 7.0x |
| 2 | Brandon | 102 | 10,996 | $110,806 | $387,890 | 3.5x |
| 3 | Tea | 102 | 6,786 | $120,139 | $381,056 | 3.2x |
| 4 | Box Elder | 100 | 12,902 | $73,008 | $367,456 | 5.0x |
| 5 | Harrisburg | 100 | 8,519 | $108,724 | $359,383 | 3.3x |
| 6 | Sioux Falls | 99 | 201,469 | $75,970 | $329,723 | 4.3x |
| 7 | Rapid City | 99 | 77,946 | $70,870 | $361,496 | 5.1x |
| 8 | Aberdeen | 98 | 28,189 | $64,405 | $240,644 | 3.7x |
| 9 | Brookings | 98 | 23,948 | $63,493 | $312,178 | 4.9x |
| 10 | Pierre | 98 | 13,948 | $77,672 | $293,980 | 3.8x |
| 11 | Watertown | 97 | 23,044 | $69,600 | $304,838 | 4.4x |
| 12 | Sturgis | 95 | 7,086 | $54,404 | $370,733 | 6.8x |
| 13 | Vermillion | 94 | 11,878 | $50,456 | $272,882 | 5.4x |
| 14 | Mitchell | 93 | 15,649 | $58,620 | $247,683 | 4.2x |
| 15 | Yankton | 91 | 15,540 | $67,804 | $270,787 | 4.0x |
| 16 | Belle Fourche | 89 | 5,804 | $65,071 | $334,320 | 5.1x |
| 17 | Huron | 87 | 14,385 | $61,452 | $171,872 | 2.8x |
| 18 | Madison | 86 | 6,094 | $65,593 | $263,104 | 4.0x |
Source: U.S. Census ACS 2020-2024, Zillow research. 18 places with more than 5,000 residents.
Summary
Summary: Taking A Chunk Out Of Your Paycheck In South Dakota For 2026
Well, there you have it, the places in South Dakota that have the highest cost of living, with Spearfish ranking as the most expensive city in the Mount Rushmore State.
The most expensive cities in South Dakota are Spearfish, Brandon, Tea, Box Elder, Harrisburg, Sioux Falls, Rapid City, Aberdeen, Brookings, and Pierre.