
Before you decide to relocate to Vermont, it’s important to research the exact cost of living around the state. And that’s what we’re going to help you do.
These are the places in Vermont that cost a pretty penny — the most expensive cities in the state.
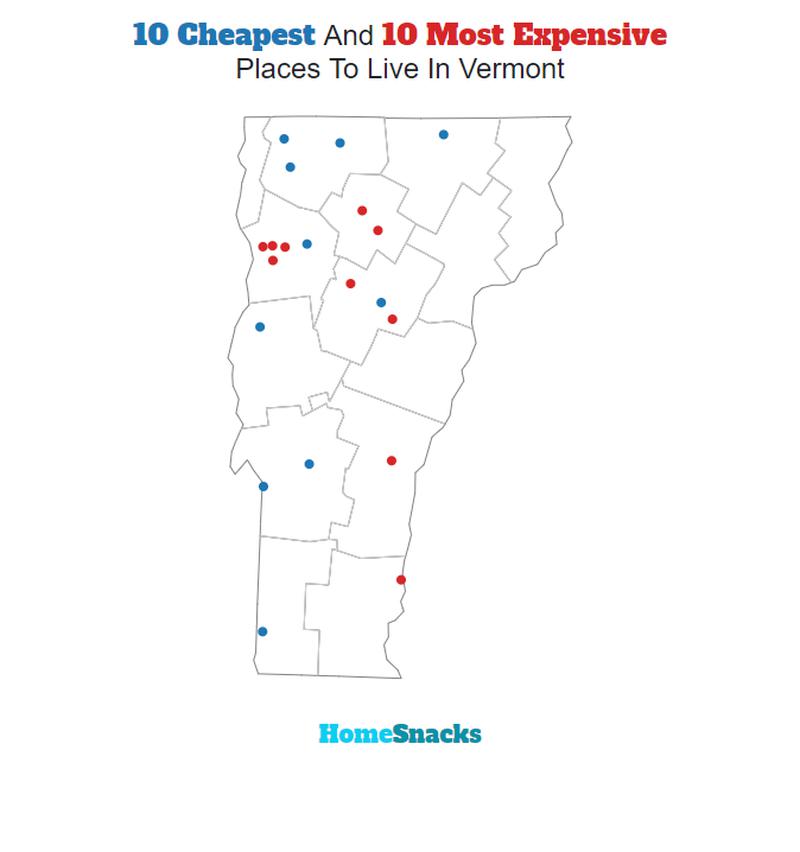
We used Saturday Night Science to compare the 2020-2024 American Community Survey on cost of living for the 12 places in Vermont with more than 5,000 people.
After we saved up for months and could finally afford it, we landed on this list of the ten most expensive cities in Vermont for 2026.
Table Of Contents: Top Ten | Methodology | Summary | Table
The 10 Most Expensive Places To Live In Vermont For 2026
What’s the most expensive place to live in Vermont? Well, HomeSnacks crunched the numbers and discovered that Shelburne is the most expensive place to live in Vermont.
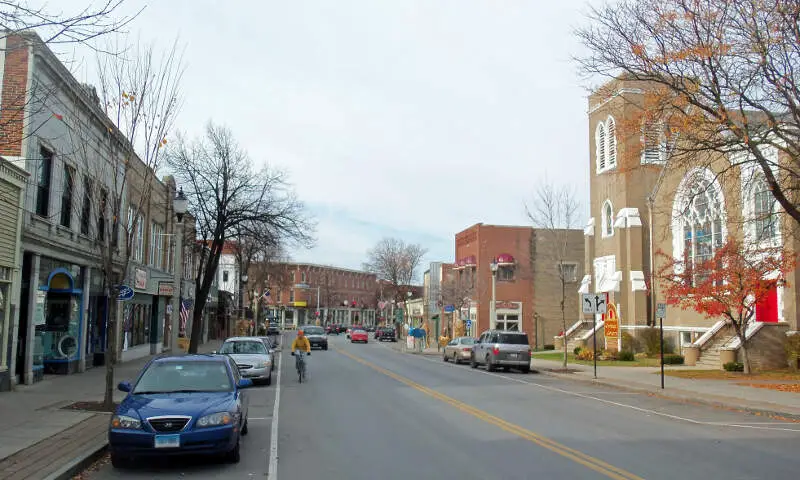
St. Johnsbury (the cheapest place to live in Vermont) can show these guys how to live on a budget in the coming years. Read on for how these places had costs rise faster than inflation.
And if you already knew these places were expensive, check out some more reading about Vermont and the most expensive cities in the country:
The 10 Most Expensive Places To Live In Vermont For 2026
/10
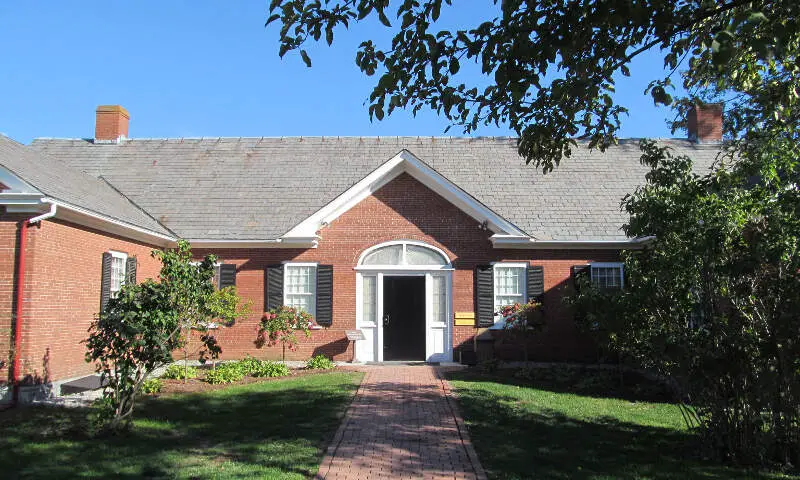
Population: 6,499
Cost Of Living Index: 131
Median Income: $109,583
Average Home Price: $689,015
Home Price To Income Ratio: 6.3x
More on Shelburne: Data | Crime | Cost Of Living | Movers
The overall cost of living in Shelburne is 131. The median income in Shelburne comes in at $109,583 and the average home value is $689,015 for 2026.

/10
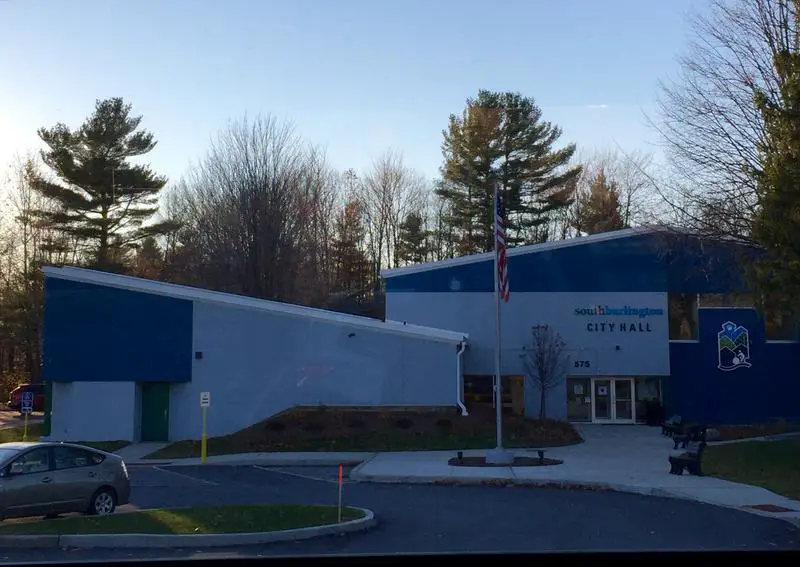
Population: 20,756
Cost Of Living Index: 122
Median Income: $106,667
Average Home Price: $481,493
Home Price To Income Ratio: 4.5x
More on South Burlington: Data | Crime | Cost Of Living | Movers
The overall cost of living in South Burlington is 122. The median income in South Burlington comes in at $106,667 and the average home value is $481,493 for 2026.

/10
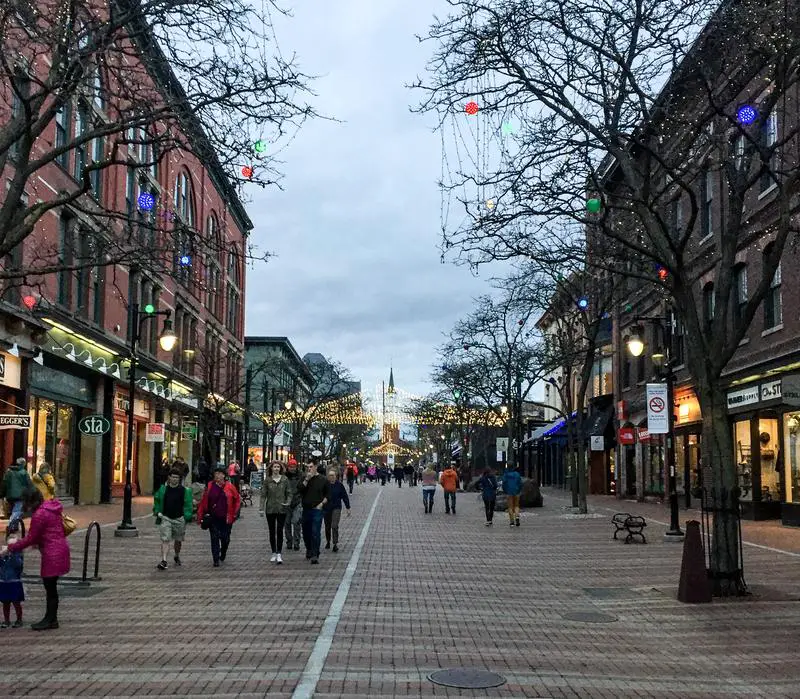
Population: 44,675
Cost Of Living Index: 121
Median Income: $71,109
Average Home Price: $506,784
Home Price To Income Ratio: 7.1x
More on Burlington: Data | Crime | Cost Of Living | Movers
The overall cost of living in Burlington is 121. The median income in Burlington comes in at $71,109 and the average home value is $506,784 for 2026.

/10
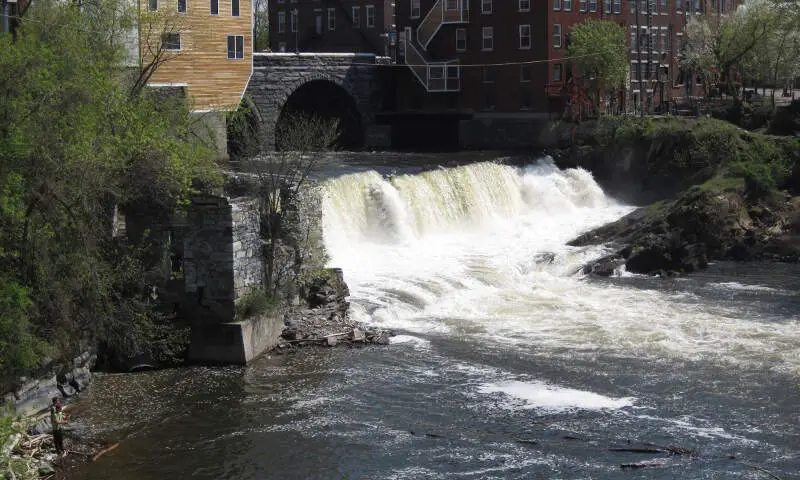
Population: 7,220
Cost Of Living Index: 120
Median Income: $86,250
Average Home Price: $451,189
Home Price To Income Ratio: 5.2x
More on Middlebury: Data | Crime | Cost Of Living | Movers
The overall cost of living in Middlebury is 120. The median income in Middlebury comes in at $86,250 and the average home value is $451,189 for 2026.

/10
Population: 8,293
Cost Of Living Index: 111
Median Income: $79,522
Average Home Price: $427,517
Home Price To Income Ratio: 5.4x
More on Winooski: Data | Crime | Cost Of Living | Movers
The overall cost of living in Winooski is 111. The median income in Winooski comes in at $79,522 and the average home value is $427,517 for 2026.

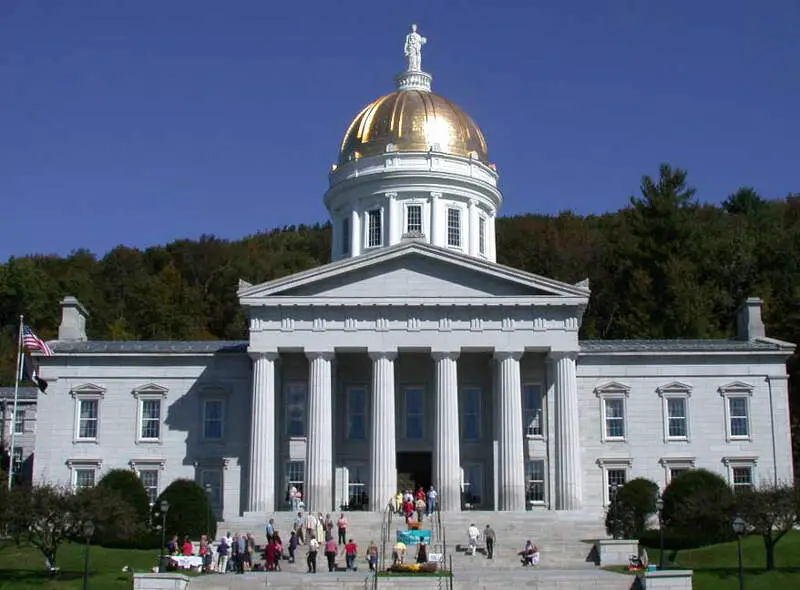
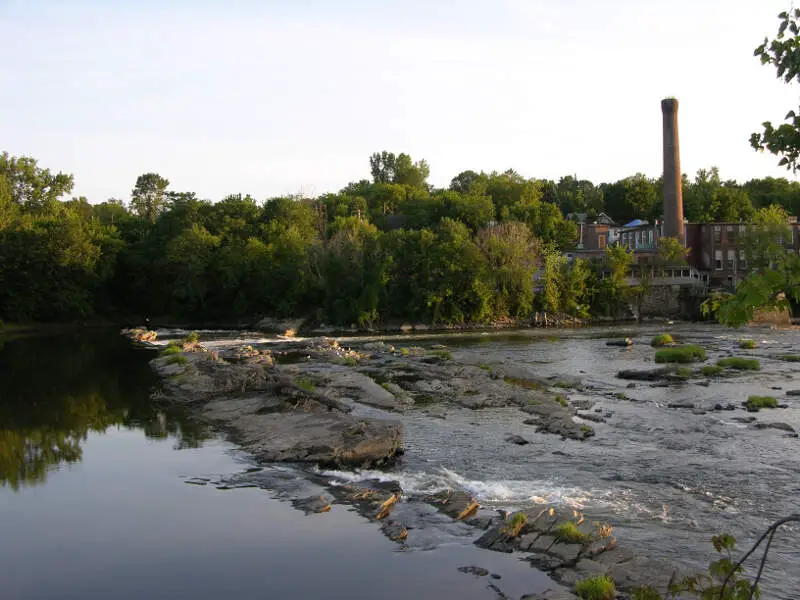
/10
Population: 8,014
Cost Of Living Index: 111
Median Income: $81,030
Average Home Price: $414,351
Home Price To Income Ratio: 5.1x
More on Montpelier: Data | Crime | Cost Of Living | Movers
The overall cost of living in Montpelier is 111. The median income in Montpelier comes in at $81,030 and the average home value is $414,351 for 2026.

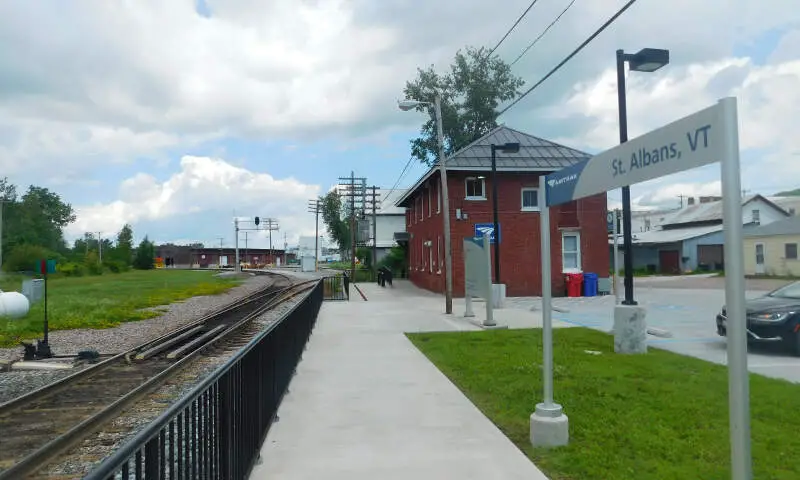
/10
Population: 6,954
Cost Of Living Index: 106
Median Income: $57,980
Average Home Price: $361,248
Home Price To Income Ratio: 6.2x
More on St. Albans: Data | Crime | Cost Of Living | Movers
The overall cost of living in St. Albans is 106. The median income in St. Albans comes in at $57,980 and the average home value is $361,248 for 2026.

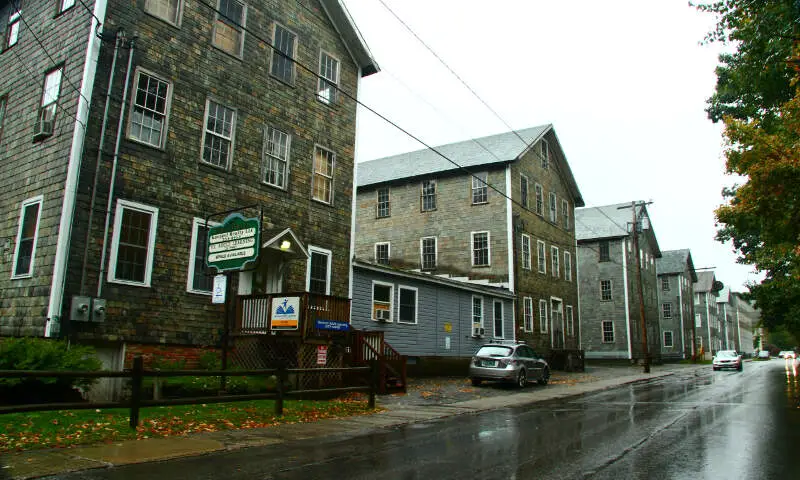
/10
Population: 7,657
Cost Of Living Index: 105
Median Income: $52,734
Average Home Price: $314,812
Home Price To Income Ratio: 6.0x
More on Brattleboro: Data | Crime | Cost Of Living | Movers
The overall cost of living in Brattleboro is 105. The median income in Brattleboro comes in at $52,734 and the average home value is $314,812 for 2026.

/10
Population: 9,245
Cost Of Living Index: 103
Median Income: $54,257
Average Home Price: $243,917
Home Price To Income Ratio: 4.5x
More on Bennington: Data | Crime | Cost Of Living | Movers
The overall cost of living in Bennington is 103. The median income in Bennington comes in at $54,257 and the average home value is $243,917 for 2026.

/10
Population: 15,712
Cost Of Living Index: 99
Median Income: $57,675
Average Home Price: $276,480
Home Price To Income Ratio: 4.8x
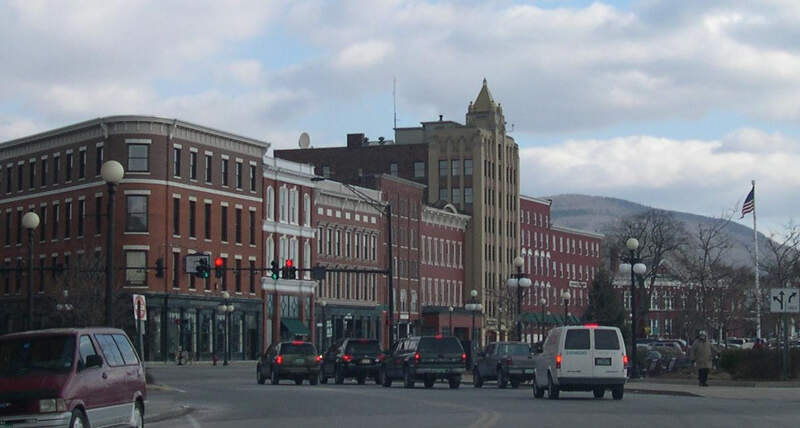
More on Rutland: Data | Crime | Cost Of Living | Movers
The overall cost of living in Rutland is 99. The median income in Rutland comes in at $57,675 and the average home value is $276,480 for 2026.
Methodology: How We Determined The Most Expensive Places To Live In The Green Mountain State For 2026
The two most important things to think about when it comes to being able to afford a city in Vermont are:
- How much money do I make?
- How much do I have to spend to live there?
You need to understand your costs in the context of how much money you make.
For example, if the median household earns $100,000 and spends $40,000 on housing, it’s actually cheaper to live there than a place with a median income of $50,000 and housing costs of $21,000. You might spend more on housing, but you have more money overall to play with.
With that example in mind, we derived several statistics from the latest Census American Community Survey 2020-2024 around incomes and costs. They are:
- Overall Cost Of Living Index
- Median Home Price / Median Income (lower is better)
- Median Income / Median Rent (Higher is better)
- Median Home Price
You can then compare these metrics in each of the places in Vermont to figure out which is the most expensive.
You are left with a “Cost of Living Index” by taking the average rank of each of these metrics for each city.
So we used that cost of living index to rank all of the 12 places in Vermont that have more than 5,000 people.
The place with the highest cost of living in Vermont according to the data is Shelburne. We updated this article for 2026. This article is our eleventh time ranking the most expensive places to live in Vermont.
Summary: Taking A Chunk Out Of Your Paycheck In Vermont For 2026
Well, there you have it, the places in Vermont that have the highest cost of living, with Shelburne ranking as the most expensive city in the Green Mountain State.
The most expensive cities in Vermont are Shelburne, South Burlington, Burlington, Middlebury, Winooski, Montpelier, St. Albans, Brattleboro, Bennington, and Rutland.
Here’s a look at the most affordable cities in Vermont according to the data:
- St. Johnsbury
- Barre
- Rutland
For more Vermont reading, check out:
- Best Places To Live In Vermont
- Cheapest Places To Live In Vermont
- Most Dangerous Cities In Vermont
- Best Places To Raise A Family In Vermont
- Safest Places In Vermont
- Worst Places To Live In Vermont
Most Expensive Cities In Vermont
| Rank | City | Cost Of Living | Population | Median Income | Average Home Price | Home/Income Ratio |
|---|---|---|---|---|---|---|
| 1 | Shelburne | 131 | 6,499 | $109,583 | $689,015 | 6.3x |
| 2 | South Burlington | 122 | 20,756 | $106,667 | $481,493 | 4.5x |
| 3 | Burlington | 121 | 44,675 | $71,109 | $506,784 | 7.1x |
| 4 | Middlebury | 120 | 7,220 | $86,250 | $451,189 | 5.2x |
| 5 | Winooski | 111 | 8,293 | $79,522 | $427,517 | 5.4x |
| 6 | Montpelier | 111 | 8,014 | $81,030 | $414,351 | 5.1x |
| 7 | St. Albans | 106 | 6,954 | $57,980 | $361,248 | 6.2x |
| 8 | Brattleboro | 105 | 7,657 | $52,734 | $314,812 | 6.0x |
| 9 | Bennington | 103 | 9,245 | $54,257 | $243,917 | 4.5x |
| 10 | Rutland | 99 | 15,712 | $57,675 | $276,480 | 4.8x |
| 11 | Barre | 98 | 8,412 | $65,625 | $300,280 | 4.6x |
| 12 | St. Johnsbury | 95 | 5,859 | $53,711 | $217,181 | 4.0x |