Moss Point SnackAbility
Overall SnackAbility
Cost of living in Moss Point summary. We use data on the cost of living to determine how expensive it is to live in Moss Point. Real estate prices drive most of the variance in cost of living around Mississippi. Key points include:
The cost of living in Moss Point is 85 with 100 being average.
The cost of living in Moss Point is 0.8x lower than the national average.
The median home value in Moss Point is $146,443.
The median income in Moss Point is $44,296.
Moss Point's Overall Cost Of Living
Lower Than The National Average
Cost Of Living In Moss Point Comparison Table
| Living Expense | Moss Point | Mississippi | National Average |
|---|---|---|---|
| Overall | 85 | 88 | 100 |
| Services | 97 | 99 | 100 |
| Groceries | 98 | 97 | 100 |
| Health | 65 | 63 | 100 |
| Housing | 98 | 94 | 100 |
| Transportation | 97 | 97 | 100 |
| Utilities | 96 | 93 | 100 |
Source: Cost of living index, normalized to US average = 100
Moss Point, MS Weather
The average high in Moss Point is 76.6° and the average low is 58.3°.
There are 70.2 days of precipitation each year.
Expect an average of 64.7 inches of precipitation each year with 0.0 inches of snow.
| Stat | Moss Point |
|---|---|
| Average Annual High | 76.6 |
| Average Annual Low | 58.3 |
| Annual Precipitation Days | 70.2 |
| Average Annual Precipitation | 64.7 |
| Average Annual Snowfall | 0.0 |
Average High
Days of Rain
Source: NOAA climate normals (30-year)
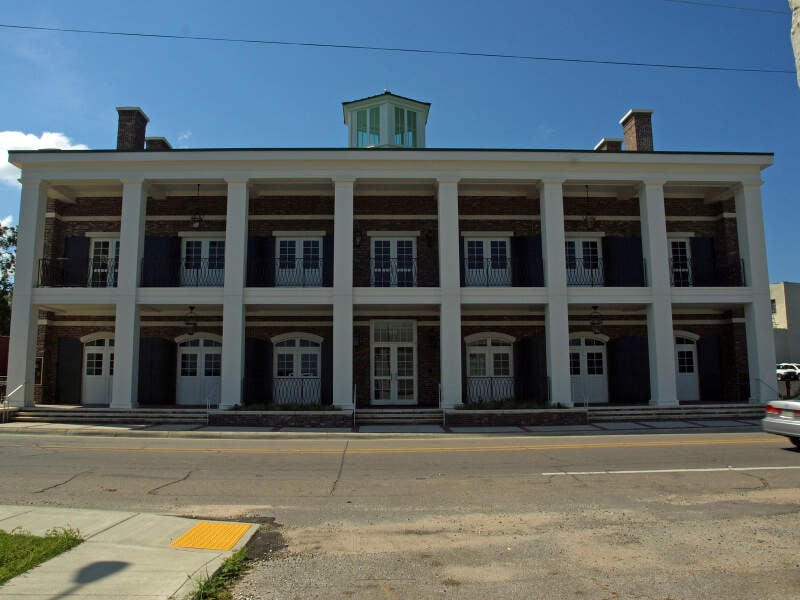
Moss Point, MS Photos
1 Reviews & Comments About Moss Point

I'm from Moss Point, Mississippi and it's ridiculous not rediculous you're just making us look worse.
Rankings & Articles For Moss Point


Locations Around Moss Point
Map Of Moss Point, MS
Best Places Around Moss Point
Gulf Hills, MS
Population 8,451
Ocean Springs, MS
Population 18,646
Gulf Park Estates, MS
Population 6,264
Latimer, MS
Population 6,756
St. Martin, MS
Population 8,139
Gautier, MS
Population 19,046
Pascagoula, MS
Population 21,710
Moss Point Demographics And Statistics
Population over time in Moss Point
The current population in Moss Point is 11,957. The population has decreased 14.4% from 2010.
| Year | Population | % Change |
|---|---|---|
| 2024 | 11,957 | -0.9% |
| 2023 | 12,066 | -0.9% |
| 2022 | 12,173 | -0.9% |
| 2021 | 12,282 | -8.3% |
| 2020 | 13,396 | -0.4% |
| 2019 | 13,451 | -0.3% |
| 2018 | 13,487 | -0.1% |
| 2017 | 13,501 | -1.1% |
| 2016 | 13,652 | -0.2% |
| 2015 | 13,685 | -0.0% |
| 2014 | 13,690 | -0.4% |
| 2013 | 13,749 | -0.4% |
| 2012 | 13,807 | -0.6% |
| 2011 | 13,885 | -0.6% |
| 2010 | 13,963 | - |
Race / Ethnicity in Moss Point
See the full breakdown
Moss Point is:
22.5% White with 2,692 White residents.
68.7% African American with 8,211 African American residents.
0.0% American Indian with 4 American Indian residents.
0.8% Asian with 100 Asian residents.
0.0% Hawaiian with 0 Hawaiian residents.
0.3% Other with 35 Other residents.
1.4% Two Or More with 171 Two Or More residents.
6.2% Hispanic with 744 Hispanic residents.
| Race | Moss Point | MS | USA |
|---|---|---|---|
| White | 22.5% | 55.2% | 57.4% |
| African American | 68.7% | 36.3% | 11.9% |
| American Indian | 0.0% | 0.4% | 0.5% |
| Asian | 0.8% | 1.0% | 5.9% |
| Hawaiian | 0.0% | 0.0% | 0.2% |
| Other | 0.3% | 0.3% | 0.6% |
| Two Or More | 1.4% | 3.0% | 4.3% |
| Hispanic | 6.2% | 3.7% | 19.3% |
Gender in Moss Point
See the full breakdown
Moss Point is 53.4% female with 6,383 female residents.
Moss Point is 46.6% male with 5,574 male residents.
| Gender | Moss Point | MS | USA |
|---|---|---|---|
| Female | 53.4% | 51.5% | 50.5% |
| Male | 46.6% | 48.5% | 49.5% |
Highest level of educational attainment in Moss Point for adults over 25
See the full breakdown
9.0% of adults in Moss Point completed < 9th grade.
10.0% of adults in Moss Point completed 9-12th grade.
36.0% of adults in Moss Point completed high school / ged.
24.0% of adults in Moss Point completed some college.
8.0% of adults in Moss Point completed associate's degree.
9.0% of adults in Moss Point completed bachelor's degree.
4.0% of adults in Moss Point completed master's degree.
0.0% of adults in Moss Point completed professional degree.
0.0% of adults in Moss Point completed doctorate degree.
| Education | Moss Point | MS | USA |
|---|---|---|---|
| < 9th Grade | 9.0% | 4.0% | 4.0% |
| 9-12th Grade | 10.0% | 9.0% | 6.0% |
| High School / GED | 36.0% | 30.0% | 26.0% |
| Some College | 24.0% | 21.0% | 19.0% |
| Associate's Degree | 8.0% | 11.0% | 9.0% |
| Bachelor's Degree | 9.0% | 15.0% | 22.0% |
| Master's Degree | 4.0% | 7.0% | 10.0% |
| Professional Degree | 0.0% | 2.0% | 2.0% |
| Doctorate Degree | 0.0% | 1.0% | 2.0% |
Household Income For Moss Point, Mississippi
See the full breakdown
9.5% of households in Moss Point earn Less than $10,000.
7.4% of households in Moss Point earn $10,000 to $14,999.
16.5% of households in Moss Point earn $15,000 to $24,999.
9.7% of households in Moss Point earn $25,000 to $34,999.
13.9% of households in Moss Point earn $35,000 to $49,999.
16.8% of households in Moss Point earn $50,000 to $74,999.
10.6% of households in Moss Point earn $75,000 to $99,999.
9.1% of households in Moss Point earn $100,000 to $149,999.
4.9% of households in Moss Point earn $150,000 to $199,999.
1.6% of households in Moss Point earn $200,000 or more.
| Income | Moss Point | MS | USA |
|---|---|---|---|
| Less than $10,000 | 9.5% | 7.1% | 5.0% |
| $10,000 to $14,999 | 7.4% | 6.0% | 3.4% |
| $15,000 to $24,999 | 16.5% | 10.0% | 6.3% |
| $25,000 to $34,999 | 9.7% | 9.3% | 6.6% |
| $35,000 to $49,999 | 13.9% | 12.7% | 10.1% |
| $50,000 to $74,999 | 16.8% | 16.5% | 15.5% |
| $75,000 to $99,999 | 10.6% | 12.0% | 12.6% |
| $100,000 to $149,999 | 9.1% | 14.4% | 17.5% |
| $150,000 to $199,999 | 4.9% | 6.2% | 9.6% |
| $200,000 or more | 1.6% | 5.8% | 13.4% |
Source: U.S. Census ACS 5-year estimates (2024)


