Ocean Springs SnackAbility
Overall SnackAbility
Crime in Ocean Springs summary. We use data from the FBI to determine the crime rates in Ocean Springs. Key points include:
There were 434 total crimes in Ocean Springs in the last reporting year.
The overall crime rate per 100,000 people in Ocean Springs is 2,363.7 / 100k people.
The violent crime rate per 100,000 people in Ocean Springs is 98.0 / 100k people.
The property crime rate per 100,000 people in Ocean Springs is 2,265.7 / 100k people.
Overall, crime in Ocean Springs is 11.54% above the national average.
Total Crimes
Above National Average
Crime In Ocean Springs Comparison Table
| Statistic | Count Raw |
Ocean Springs / 100k People |
Mississippi / 100k People |
National / 100k People |
|---|---|---|---|---|
| Total Crimes Per 100K | 434 | 2,363.7 | 1,573.5 | 2,119.2 |
| Violent Crime | 18 | 98.0 | 210.5 | 359.0 |
| Murder | 1 | 5.4 | 7.4 | 5.0 |
| Robbery | 5 | 27.2 | 18.5 | 61.0 |
| Aggravated Assault | 9 | 49.0 | 155.4 | 256.0 |
| Property Crime | 416 | 2,265.7 | 1,363.0 | 1,760.0 |
| Burglary | 35 | 190.6 | 235.2 | 229.0 |
| Larceny | 352 | 1,917.1 | 982.5 | 1,272.0 |
| Car Theft | 29 | 157.9 | 145.3 | 259.0 |
Source: FBI Uniform Crime Reporting (2024)
Cost of living in Ocean Springs summary. We use data on the cost of living to determine how expensive it is to live in Ocean Springs. Real estate prices drive most of the variance in cost of living around Mississippi. Key points include:
The cost of living in Ocean Springs is 98 with 100 being average.
The cost of living in Ocean Springs is 1.0x lower than the national average.
The median home value in Ocean Springs is $270,587.
The median income in Ocean Springs is $79,712.
Ocean Springs's Overall Cost Of Living
Lower Than The National Average
Cost Of Living In Ocean Springs Comparison Table
| Living Expense | Ocean Springs | Mississippi | National Average |
|---|---|---|---|
| Overall | 98 | 88 | 100 |
| Services | 99 | 99 | 100 |
| Groceries | 98 | 97 | 100 |
| Health | 97 | 63 | 100 |
| Housing | 97 | 94 | 100 |
| Transportation | 97 | 97 | 100 |
| Utilities | 97 | 93 | 100 |
Source: Cost of living index, normalized to US average = 100
Ocean Springs, MS Weather
The average high in Ocean Springs is 76.4° and the average low is 59.3°.
There are 82.4 days of precipitation each year.
Expect an average of 64.6 inches of precipitation each year with 0.3 inches of snow.
| Stat | Ocean Springs |
|---|---|
| Average Annual High | 76.4 |
| Average Annual Low | 59.3 |
| Annual Precipitation Days | 82.4 |
| Average Annual Precipitation | 64.6 |
| Average Annual Snowfall | 0.3 |
Average High
Days of Rain
Source: NOAA climate normals (30-year)
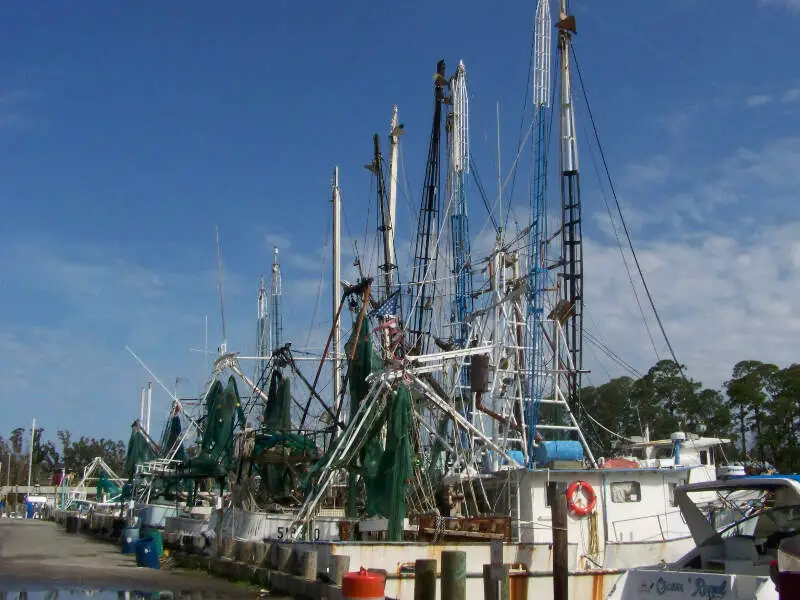
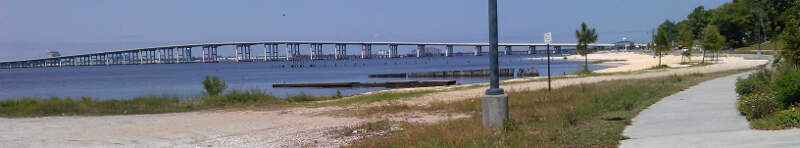
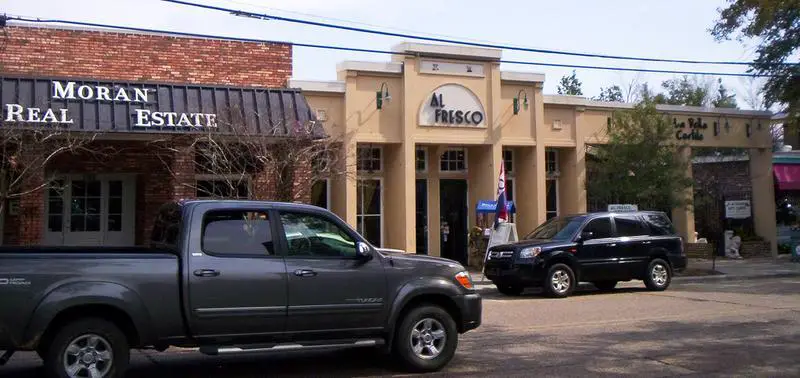
Ocean Springs, MS Photos


1 Reviews & Comments About Ocean Springs

I live in Ocean Springs. I guess we made it on the list because of the bars. I think the criteria may need to be a little different. There are a lot of bars, but very few are redneck bars. I can think of several cities that are more redneck, such as Helena, Vancleave, Saucier...I guess because they have no bars they didn't make it. It's a fun article anyway.
Rankings & Articles For Ocean Springs


Locations Around Ocean Springs
Map Of Ocean Springs, MS
Best Places Around Ocean Springs
Gulf Hills, MS
Population 8,451
Gulf Park Estates, MS
Population 6,264
D'Iberville, MS
Population 13,203
Latimer, MS
Population 6,756
St. Martin, MS
Population 8,139
Gautier, MS
Population 19,046
Pascagoula, MS
Population 21,710
Biloxi, MS
Population 48,861
Gulfport, MS
Population 73,003
Ocean Springs Demographics And Statistics
Population over time in Ocean Springs
The current population in Ocean Springs is 18,646. The population has increased 8.0% from 2010.
| Year | Population | % Change |
|---|---|---|
| 2024 | 18,646 | 0.5% |
| 2023 | 18,561 | 0.8% |
| 2022 | 18,417 | 0.8% |
| 2021 | 18,275 | 2.9% |
| 2020 | 17,756 | 0.2% |
| 2019 | 17,729 | 0.7% |
| 2018 | 17,613 | 0.6% |
| 2017 | 17,514 | -0.2% |
| 2016 | 17,547 | 0.1% |
| 2015 | 17,528 | 0.5% |
| 2014 | 17,446 | -0.2% |
| 2013 | 17,474 | 0.3% |
| 2012 | 17,420 | 0.2% |
| 2011 | 17,379 | 0.7% |
| 2010 | 17,258 | - |
Race / Ethnicity in Ocean Springs
See the full breakdown
Ocean Springs is:
76.6% White with 14,278 White residents.
7.4% African American with 1,384 African American residents.
0.1% American Indian with 16 American Indian residents.
4.9% Asian with 905 Asian residents.
0.0% Hawaiian with 0 Hawaiian residents.
0.2% Other with 44 Other residents.
2.4% Two Or More with 453 Two Or More residents.
8.4% Hispanic with 1,566 Hispanic residents.
| Race | Ocean Springs | MS | USA |
|---|---|---|---|
| White | 76.6% | 55.2% | 57.4% |
| African American | 7.4% | 36.3% | 11.9% |
| American Indian | 0.1% | 0.4% | 0.5% |
| Asian | 4.9% | 1.0% | 5.9% |
| Hawaiian | 0.0% | 0.0% | 0.2% |
| Other | 0.2% | 0.3% | 0.6% |
| Two Or More | 2.4% | 3.0% | 4.3% |
| Hispanic | 8.4% | 3.7% | 19.3% |
Gender in Ocean Springs
See the full breakdown
Ocean Springs is 48.6% female with 9,065 female residents.
Ocean Springs is 51.4% male with 9,581 male residents.
| Gender | Ocean Springs | MS | USA |
|---|---|---|---|
| Female | 48.6% | 51.5% | 50.5% |
| Male | 51.4% | 48.5% | 49.5% |
Highest level of educational attainment in Ocean Springs for adults over 25
See the full breakdown
2.0% of adults in Ocean Springs completed < 9th grade.
4.0% of adults in Ocean Springs completed 9-12th grade.
16.0% of adults in Ocean Springs completed high school / ged.
20.0% of adults in Ocean Springs completed some college.
11.0% of adults in Ocean Springs completed associate's degree.
27.0% of adults in Ocean Springs completed bachelor's degree.
13.0% of adults in Ocean Springs completed master's degree.
4.0% of adults in Ocean Springs completed professional degree.
3.0% of adults in Ocean Springs completed doctorate degree.
| Education | Ocean Springs | MS | USA |
|---|---|---|---|
| < 9th Grade | 2.0% | 4.0% | 4.0% |
| 9-12th Grade | 4.0% | 9.0% | 6.0% |
| High School / GED | 16.0% | 30.0% | 26.0% |
| Some College | 20.0% | 21.0% | 19.0% |
| Associate's Degree | 11.0% | 11.0% | 9.0% |
| Bachelor's Degree | 27.0% | 15.0% | 22.0% |
| Master's Degree | 13.0% | 7.0% | 10.0% |
| Professional Degree | 4.0% | 2.0% | 2.0% |
| Doctorate Degree | 3.0% | 1.0% | 2.0% |
Household Income For Ocean Springs, Mississippi
See the full breakdown
5.5% of households in Ocean Springs earn Less than $10,000.
2.6% of households in Ocean Springs earn $10,000 to $14,999.
5.3% of households in Ocean Springs earn $15,000 to $24,999.
4.6% of households in Ocean Springs earn $25,000 to $34,999.
11.9% of households in Ocean Springs earn $35,000 to $49,999.
17.5% of households in Ocean Springs earn $50,000 to $74,999.
13.9% of households in Ocean Springs earn $75,000 to $99,999.
19.9% of households in Ocean Springs earn $100,000 to $149,999.
9.3% of households in Ocean Springs earn $150,000 to $199,999.
9.6% of households in Ocean Springs earn $200,000 or more.
| Income | Ocean Springs | MS | USA |
|---|---|---|---|
| Less than $10,000 | 5.5% | 7.1% | 5.0% |
| $10,000 to $14,999 | 2.6% | 6.0% | 3.4% |
| $15,000 to $24,999 | 5.3% | 10.0% | 6.3% |
| $25,000 to $34,999 | 4.6% | 9.3% | 6.6% |
| $35,000 to $49,999 | 11.9% | 12.7% | 10.1% |
| $50,000 to $74,999 | 17.5% | 16.5% | 15.5% |
| $75,000 to $99,999 | 13.9% | 12.0% | 12.6% |
| $100,000 to $149,999 | 19.9% | 14.4% | 17.5% |
| $150,000 to $199,999 | 9.3% | 6.2% | 9.6% |
| $200,000 or more | 9.6% | 5.8% | 13.4% |
Source: U.S. Census ACS 5-year estimates (2024)


