Camden SnackAbility
Overall SnackAbility
Cost of living in Camden summary. We use data on the cost of living to determine how expensive it is to live in Camden. Real estate prices drive most of the variance in cost of living around New Jersey. Key points include:
The cost of living in Camden is 96 with 100 being average.
The cost of living in Camden is 1.0x lower than the national average.
The median home value in Camden is $147,232.
The median income in Camden is $40,546.
Camden's Overall Cost Of Living
Lower Than The National Average
Cost Of Living In Camden Comparison Table
| Living Expense | Camden | New Jersey | National Average |
|---|---|---|---|
| Overall | 96 | 125 | 100 |
| Services | 109 | 107 | 100 |
| Groceries | 111 | 113 | 100 |
| Health | 61 | 155 | 100 |
| Housing | 113 | 116 | 100 |
| Transportation | 108 | 112 | 100 |
| Utilities | 114 | 113 | 100 |
Source: Cost of living index, normalized to US average = 100
Camden, NJ Weather
The average high in Camden is 64.9° and the average low is 47.6°.
There are 80.6 days of precipitation each year.
Expect an average of 46.4 inches of precipitation each year with 13.4 inches of snow.
| Stat | Camden |
|---|---|
| Average Annual High | 64.9 |
| Average Annual Low | 47.6 |
| Annual Precipitation Days | 80.6 |
| Average Annual Precipitation | 46.4 |
| Average Annual Snowfall | 13.4 |
Average High
Days of Rain
Source: NOAA climate normals (30-year)
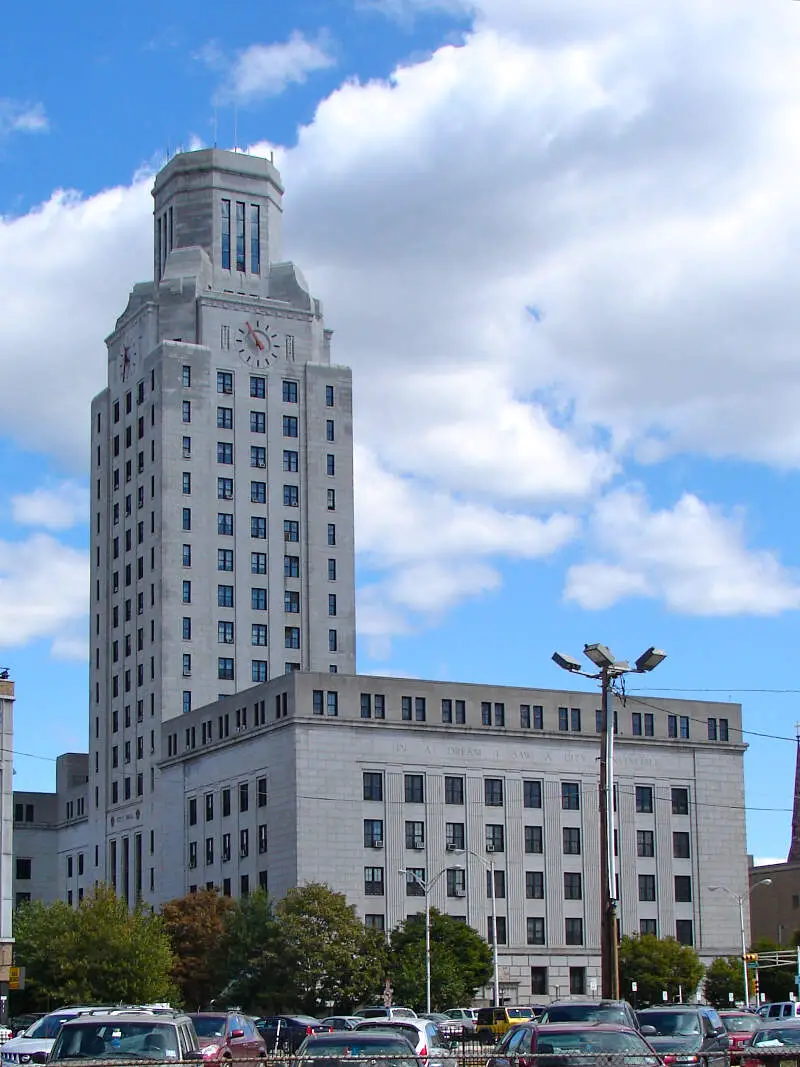
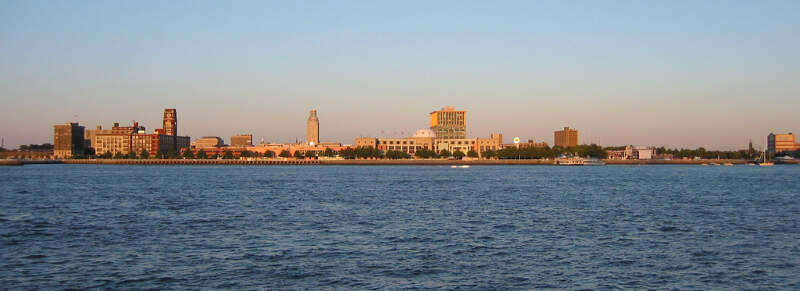
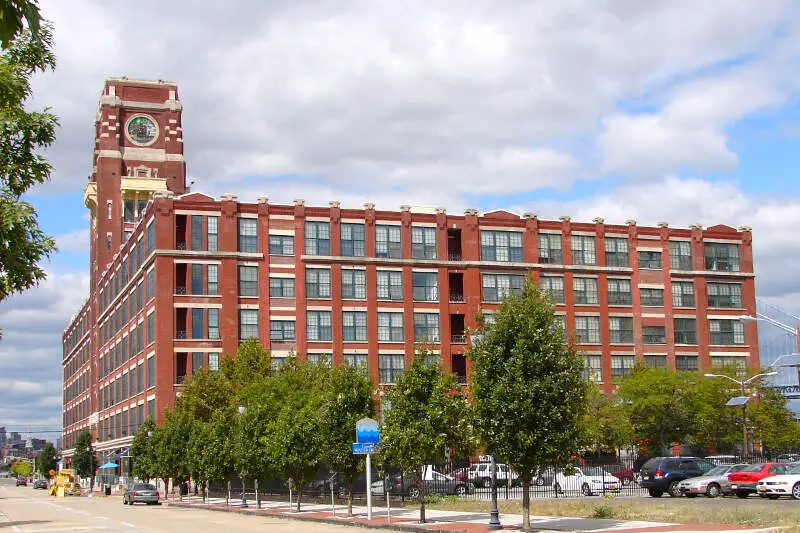
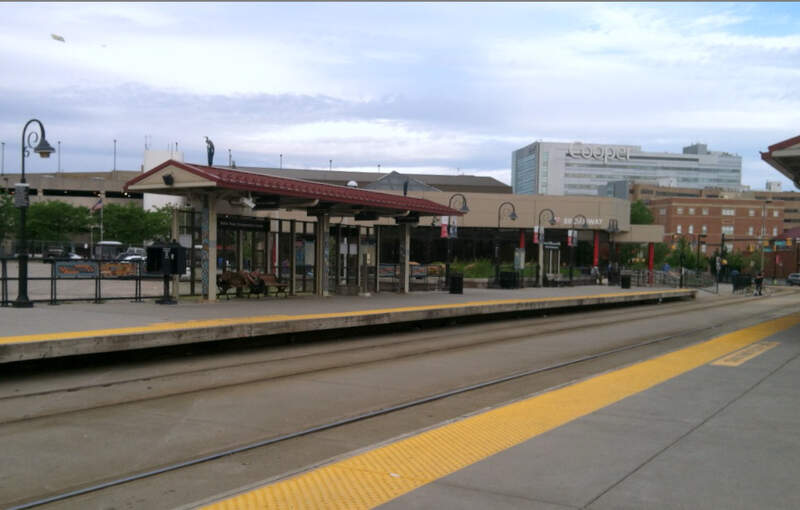
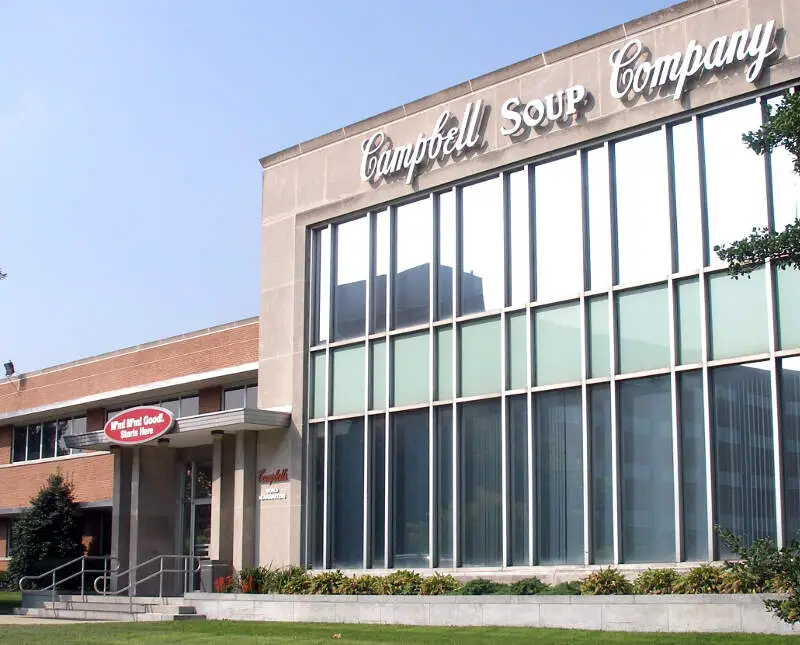
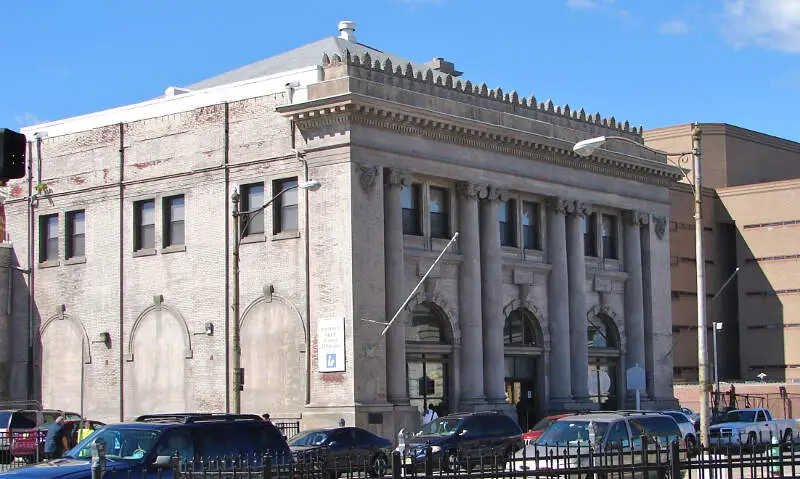
Camden, NJ Photos

3 Reviews & Comments About Camden

I don't why this c**p came recommended but all I have to say is that some of that stuff said about Camden is not true. I've lived there for a long time, trust me, there's a lot of people bringing drugs into the city so they can frame the people living there. There's no dna testing truck, I've been to each part of Camden and there hasn't been a single one. The education is fine for me, like I got accepted into a high stats art school and so many others that go to that school had gotten a free college scholarship!!
I live in Camden the city all he showed were the worst streets we have, take an actual look at Camden. The beautiful churches, our hospitals, and our community as a whole, not just some statistics.
I was born in camden nj. In 1968. Grew up in magnolia not too far from camden. Im in va. Now. and my youngest gransons name is Camden. Lol true story.
Rankings & Articles For Camden


Locations Around Camden
Map Of Camden, NJ
Best Places Around Camden
Ashland, NJ
Population 9,320
Springdale, NJ
Population 15,173
Ramblewood, NJ
Population 6,611
Greentree, NJ
Population 11,537
Penn Wynne, PA
Population 6,070
Oreland, PA
Population 5,953
Glenside, PA
Population 7,659
Wyndmoor, PA
Population 5,633
Maple Glen, PA
Population 6,643
Ardmore, PA
Population 13,909
Camden Demographics And Statistics
Population over time in Camden
The current population in Camden is 71,496. The population has decreased 8.4% from 2010.
| Year | Population | % Change |
|---|---|---|
| 2024 | 71,496 | 0.0% |
| 2023 | 71,471 | -0.5% |
| 2022 | 71,799 | -0.8% |
| 2021 | 72,381 | -1.8% |
| 2020 | 73,742 | -0.4% |
| 2019 | 74,002 | -0.8% |
| 2018 | 74,608 | -1.2% |
| 2017 | 75,550 | -0.6% |
| 2016 | 76,005 | -1.2% |
| 2015 | 76,904 | -0.5% |
| 2014 | 77,294 | -0.1% |
| 2013 | 77,356 | -0.3% |
| 2012 | 77,606 | -0.2% |
| 2011 | 77,739 | -0.4% |
| 2010 | 78,047 | - |
Race / Ethnicity in Camden
See the full breakdown
Camden is:
3.7% White with 2,665 White residents.
38.3% African American with 27,387 African American residents.
0.1% American Indian with 61 American Indian residents.
1.7% Asian with 1,196 Asian residents.
0.0% Hawaiian with 1 Hawaiian residents.
0.4% Other with 290 Other residents.
2.3% Two Or More with 1,637 Two Or More residents.
53.5% Hispanic with 38,259 Hispanic residents.
| Race | Camden | NJ | USA |
|---|---|---|---|
| White | 3.7% | 50.9% | 57.4% |
| African American | 38.3% | 12.2% | 11.9% |
| American Indian | 0.1% | 0.1% | 0.5% |
| Asian | 1.7% | 10.0% | 5.9% |
| Hawaiian | 0.0% | 0.0% | 0.2% |
| Other | 0.4% | 0.8% | 0.6% |
| Two Or More | 2.3% | 3.5% | 4.3% |
| Hispanic | 53.5% | 22.5% | 19.3% |
Gender in Camden
See the full breakdown
Camden is 53.5% female with 38,224 female residents.
Camden is 46.5% male with 33,272 male residents.
| Gender | Camden | NJ | USA |
|---|---|---|---|
| Female | 53.5% | 50.8% | 50.5% |
| Male | 46.5% | 49.2% | 49.5% |
Highest level of educational attainment in Camden for adults over 25
See the full breakdown
15.0% of adults in Camden completed < 9th grade.
16.0% of adults in Camden completed 9-12th grade.
36.0% of adults in Camden completed high school / ged.
18.0% of adults in Camden completed some college.
5.0% of adults in Camden completed associate's degree.
6.0% of adults in Camden completed bachelor's degree.
3.0% of adults in Camden completed master's degree.
1.0% of adults in Camden completed professional degree.
0.0% of adults in Camden completed doctorate degree.
| Education | Camden | NJ | USA |
|---|---|---|---|
| < 9th Grade | 15.0% | 4.0% | 4.0% |
| 9-12th Grade | 16.0% | 5.0% | 6.0% |
| High School / GED | 36.0% | 25.0% | 26.0% |
| Some College | 18.0% | 15.0% | 19.0% |
| Associate's Degree | 5.0% | 7.0% | 9.0% |
| Bachelor's Degree | 6.0% | 26.0% | 22.0% |
| Master's Degree | 3.0% | 13.0% | 10.0% |
| Professional Degree | 1.0% | 3.0% | 2.0% |
| Doctorate Degree | 0.0% | 2.0% | 2.0% |
Household Income For Camden, New Jersey
See the full breakdown
11.2% of households in Camden earn Less than $10,000.
8.0% of households in Camden earn $10,000 to $14,999.
12.4% of households in Camden earn $15,000 to $24,999.
12.7% of households in Camden earn $25,000 to $34,999.
14.2% of households in Camden earn $35,000 to $49,999.
14.7% of households in Camden earn $50,000 to $74,999.
8.7% of households in Camden earn $75,000 to $99,999.
10.7% of households in Camden earn $100,000 to $149,999.
4.8% of households in Camden earn $150,000 to $199,999.
2.6% of households in Camden earn $200,000 or more.
| Income | Camden | NJ | USA |
|---|---|---|---|
| Less than $10,000 | 11.2% | 4.1% | 5.0% |
| $10,000 to $14,999 | 8.0% | 2.7% | 3.4% |
| $15,000 to $24,999 | 12.4% | 4.8% | 6.3% |
| $25,000 to $34,999 | 12.7% | 5.1% | 6.6% |
| $35,000 to $49,999 | 14.2% | 7.6% | 10.1% |
| $50,000 to $74,999 | 14.7% | 12.8% | 15.5% |
| $75,000 to $99,999 | 8.7% | 11.3% | 12.6% |
| $100,000 to $149,999 | 10.7% | 18.1% | 17.5% |
| $150,000 to $199,999 | 4.8% | 11.8% | 9.6% |
| $200,000 or more | 2.6% | 21.6% | 13.4% |
Source: U.S. Census ACS 5-year estimates (2024)


