We all know New Jersey is the best state in the Union. What with the bagels, diners, the shore, and all the great produce.
But because the whole state is the best, choosing the best place to live in New Jersey is hard.
We decided this question needed to be answered once and for all. So we used Saturday Night Science to compare Census, FBI, and Zillow data for the 177 places in New Jersey over 5,000 people. In particular, we looked at factors like home prices, crime rates, unemployment, and income.
And while you might have heard about Hoboken, Trenton, or Newark, New Jersey has some fantastic smaller places that we’re going to highlight today.
$186,688 median income · $843,788 median home · #1 best place in New Jersey
Hillsdale, another borough located in Bergen County, ranks as the number 1 best place to live in New Jersey. Hillsdale’s appeal lies in top-tier schools, robust demand for housing, and a low crime rate.
The town boasts the Stonybrook Swim Club with its pool complex and recreational facilities and Beechwood Park’s amphitheater, playground, and walking trails provide ample leisure options.
With a range of recreational sports and a community-oriented environment, Hillsdale remains a sought-after location for families and individuals alike, solidifying its reputation as one of the best places to live in the state.
Data | Crime | Cost of living | Movers
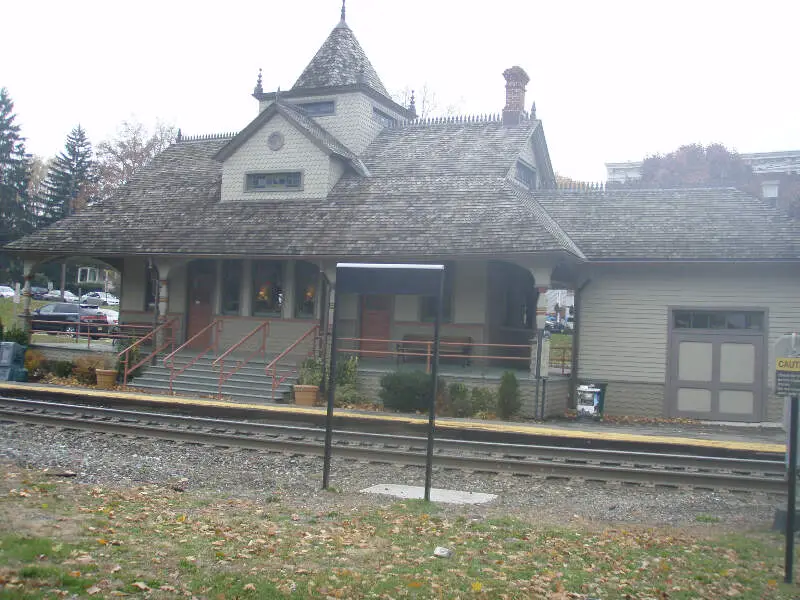
$177,962 median income · $738,299 median home · #2 best place in New Jersey
We’re sticking around Bergen County for our 2nd best place to live in New Jersey, Waldwick. At $738,299, homes in Waldwick are some of the cheapest you’ll find on this list. Residents still enjoy a high median household income of $177,962/year, which helps give Waldwick the second lowest cost of living among the cities we’re covering here. And an unemployment rate of 2.2% is the 3rd lowest in New Jersey. Just 2.9% of folks in Waldwick are on food stamps, so you know the economy is working just fine here without government assistance.
Low crime numbers and solid scores in education also make Waldwick an attractive place to live. Fans of railroad history will also be interested in visiting the Waldwick Museum.
Data | Crime | Cost of living | Movers
$171,029 median income · $845,038 median home · #3 best place in New Jersey
Coming in as the 3rd best place to live in New Jersey is Park Ridge, a borough of 9,406 located about a half-hour north of Newark.
For starters, Park Ridge ranked as one of the safest places in New Jersey, recording the 13th lowest overall crime rate statewide — the crime rate in Park Ridge is nearly half the national average.
It’s not just safe streets, though. Park Ridge has some of the best schools in New Jersey, with their elementary school scoring in the top 5% statewide and their high school receiving a College Success Award from GreatSchools.
Education has undoubtedly played a key role in reducing poverty and unemployment numbers to incredibly low levels. In fact, the median household income in Park Ridge is $171,029, and the median home price here is $845,038.
If you’re looking for fun things to do locally, the Wortendyke Dutch Barn Museum provides a unique historical perspective on Bergen County’s roots. And having Newark down the road helps meet your entertainment needs as well. After all, you can always catch a New Jersey Devils’ game or a concert at the Prudential Center.
Data | Crime | Cost of living | Movers
$232,629 median income · $1,269,853 median home · #4 best place in New Jersey
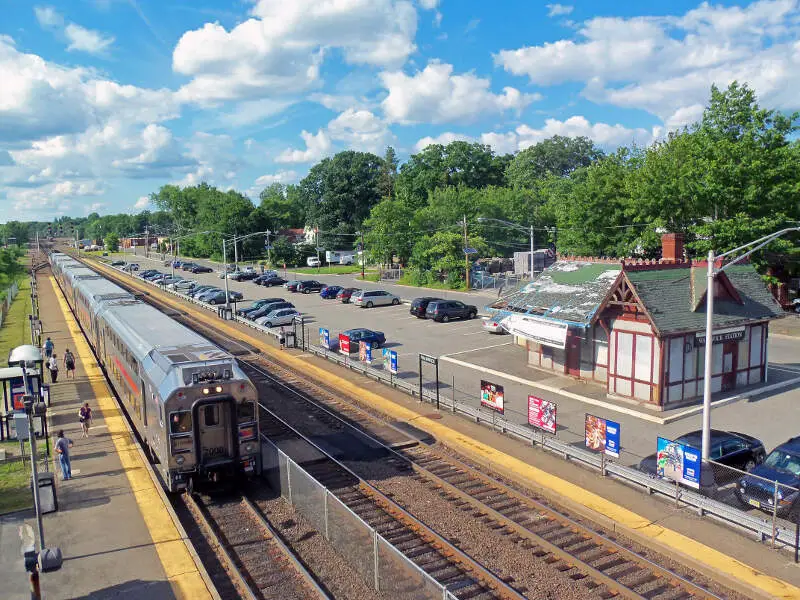
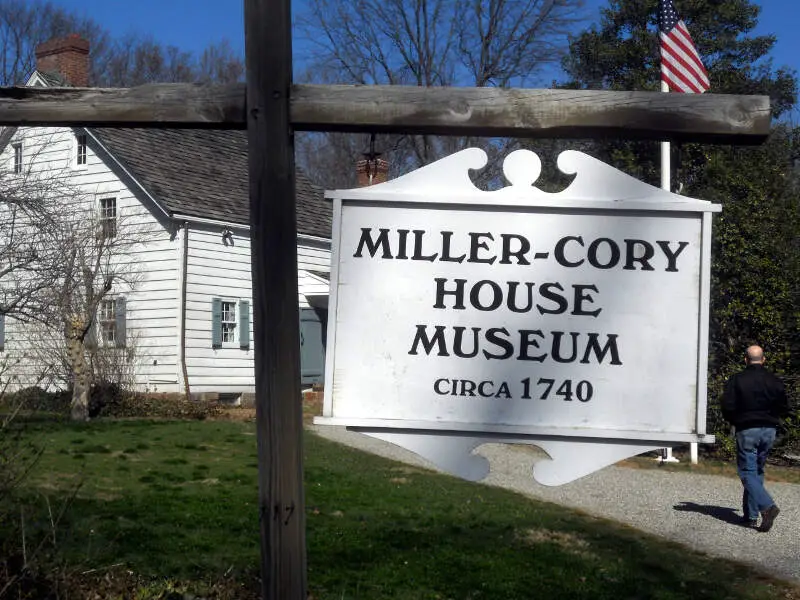
Located just west of Newark, Westfield is a town of 31,111, making it the biggest place on this list. Downtown Westfield is a regional destination with plenty of shopping, restaurants, and nightlife, so this just might be the most exciting place to live among the places we’re covering here.
Roughly 75% of Westfield residents have at least a bachelor’s degree, so you know people take education seriously here. That dedication to learning has translated into a number of economic successes. Like having the 9th highest median household income in the state at $232,629/year. Or having a poverty level of just 1.8% and the 39th highest percentage of residents with health insurance in the state, 97.3%. And with a perfect 10/10 SnackAbility score for education, you’d better believe that Westfield’s up-and-coming generation is set up nicely to continue the community’s tradition of excellence.
And since my wife grew up here, I think it’s pretty great.
Data | Crime | Cost of living | Movers
$250,001 median income · $1,483,127 median home · #5 best place in New Jersey
Fair Haven is a Monmouth County borough of 6,170 and ranks as the 5th best place to live in New Jersey. Whether you’re after a heady meal complete with live jazz or piano music at Raven & the Peach or looking for outdoors serenity at the nearby Hartshorne Woods Park, Fair Haven has you covered.
As for being family-friendly, 47.9% of Fair Haven’s households have kids, so you know that people consider it an excellent place to raise children. The statistics actually prove the truth of that, considering that GreatSchools gave Fair Haven an average score of 9/10 for its public schools, and test scores here are in the top 5% statewide.
If you don’t want to embarrass yourself at a pub quiz night in Fair Haven, you’d better get studying because 87% of adults are highly educated here (including an incredible 30% of adults with master’s degrees or higher). Additionally, 97.1% of residents have health insurance in Fair Haven, the 4highest rate in New Jersey.
But you won’t need that insurance for any crime-induced injuries. Fair Haven had the 5th lowest total crime rate over 2024.
Data | Crime | Cost of living | Movers
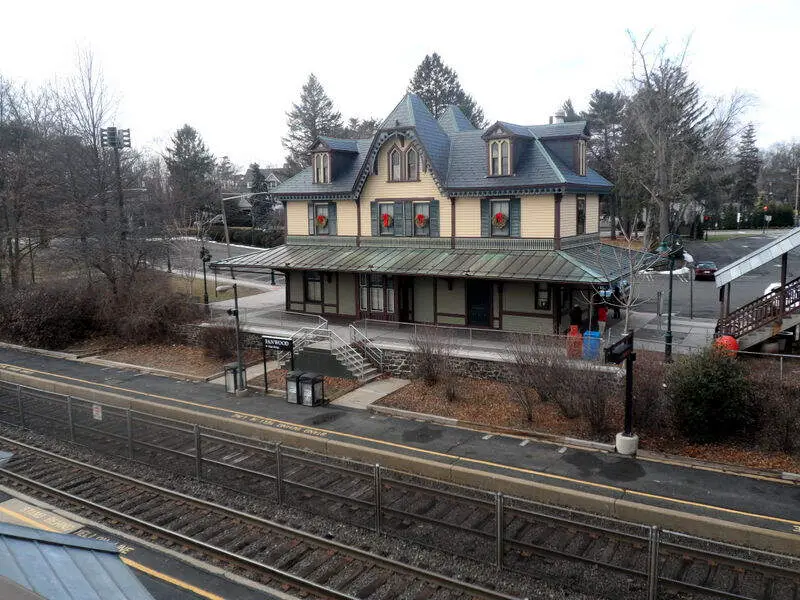
$195,529 median income · $791,728 median home · #6 best place in New Jersey
With a 1.0% poverty rate (the lowest in the state) and a median household income of $195,529, Fanwood is one of the best places to live in New Jersey. Frankly, it’s the kind of place where wealth and community actually intersect.
This Union County borough of 7,799 puts solid schools and safe streets within reach. But that combination doesn’t come cheap in Fanwood.
You’ll spot median home values near $791,728. It’s steep, but you’re getting what you pay for. The Fanwood municipal government works hard to maintain this as one of New Jersey’s best places to live.
Data | Crime | Cost of living | Movers
$221,322 median income · $975,412 median home · #7 best place in New Jersey
Oradell’s combination of safety, top-rated schools, and proximity to both nature and urban amenities make it one of the best places to live in New Jersey. This quaint borough is known for its safe and friendly neighborhoods, making it an ideal location for families.
Oradell has something to do for everyone. You can explore the beautiful Oradell Reservoir in town. Or drive the fifteen miles northwest to Midtown Manhattan for all the cultural attractions and entertainment options that New York City has to offer.
The median home price in Oradell is $975,412, making it an attractive option for those looking to settle down in a charming community without breaking the bank.
Data | Crime | Cost of living | Movers
$240,853 median income · $1,110,500 median home · #8 best place in New Jersey
Located in Monmouth County, New Jersey, Little Silver is ranked as the 8th best place to live in the state. With a population of 6,105 and a median income of 240,853, it offers its residents a high standard of living.
Little Silver enjoys access to the beautiful beaches of the Jersey Shore, which are just a short drive away. The town itself has a charming downtown area with unique shops, restaurants, and cafes.
Little Silver is highly regarded for its top-notch education system, with a high percentage of adults being highly educated. The community prides itself on providing excellent schools that consistently rank among the best in the state. This makes Little Silver an ideal place for families with children.
Data | Crime | Cost of living | Movers
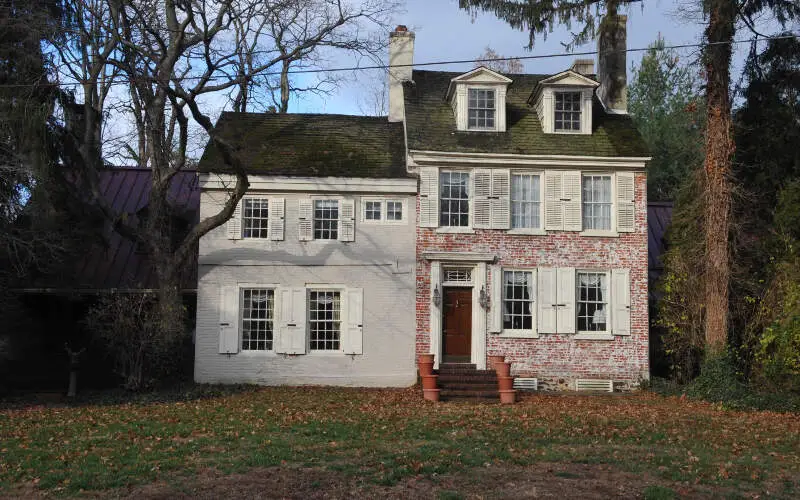
$133,125 median income · $493,148 median home · #9 best place in New Jersey
If you’re hunting for the 9th best place to live in New Jersey, Haddon Heights deserves a close look. This borough of 7,516 is just outside Philadelphia, with a median household income of $133,125 and a poverty rate of just 2.5%.
Homes cost about $493,148, and residents stick around. This is the kind of community where families stay. The median age of 42 shows that clearly.
Haddon Heights ranks as one of the best places to settle in New Jersey.
Data | Crime | Cost of living | Movers

$178,311 median income · $898,894 median home · #10 best place in New Jersey
Ranked 10th on our list of best places to live in New Jersey, Norwood is a Bergen County borough that appeals to professionals and retirees seeking a stable home base.
At 48, the median age reflects Norwood’s appeal to an older, more established demographic. Homes here sell for a median price of $898,894, with median household income at 178,311.
With an average commute of 31 minutes, Norwood proves convenient for working professionals. The quiet residential character keeps it equally appealing to retirees and empty-nesters seeking one of the best places to live in New Jersey.
Data | Crime | Cost of living | Movers
The receipts
Compare the top ten
Pick a metric. The bars rescale. The red line is New Jersey’s statewide median.
New Jersey statewide median: $103,556
New Jersey statewide median: $569,411
New Jersey statewide median: 6.3%
On the map
Mapping The Best And Worst Places To Live in New Jersey
Saturday Night Science
Methodology: How We Calculated The Best Cities To Live In New Jersey
Before we even started to collect data on the best places to live in New Jersey, we had to answer a tough question: Is it fair to pit cities with populations over 100,000 against places with a population of 18?
We firmly decided no, that just isn’t fair.
So, to create our ranking, we broke the best places to live into three tiers:
- Cities — Populations over 5,000
- Towns — Populations between 1,000 and 5,000
- Small Towns — Populations below 1,000
We then decided no matter how much anyone loves their town, the best cities to live in New Jersey have more of everything, and therefore, you need over 5,000 people to truly be ‘the best.’
Now that we had our set of the best possible cities, it was time to rank them using Saturday Night Science.
We ranked each place in New Jersey across a number of criteria from one to 177, with one being the best.
We then took the average rank across all criteria, crowning the city posting the lowest overall score, the “Best Place To Live In New Jersey.”
The criteria we looked to determine the best places were:
- Median Home Values
- Median Income
- Population Density (Higher is better)
- Unemployment Rate
- Commute Time
- Crime
- Education Levels
- Health Insurance Coverage
- Poverty rates
Sources of criteria include the New Census Data, FBI Crime Data, and Zillow. We updated this article for 2026. This report is our eleventh time ranking New Jersey’s best places to live.
If your city or town isn’t among the top 10, jump down to the bottom of the post to see a detailed chart of the best places in New Jersey. Otherwise, buckle up for a ride down good living lane with Hillsdale at the end of the cul-de-sac.
The full plate
Best Places To Live In New Jersey Table
Click any column to sort. Search by city name.
| Rank | City | Best Score | Population | Unemployment Rate | Home Value | Median Income | Rent | Total Crime /100k |
|---|---|---|---|---|---|---|---|---|
| 1 | Hillsdale | 36.90 | 10,144 | 3.4% | $843,788 | $186,688 | 266 | |
| 2 | Waldwick | 37.40 | 10,164 | 2.2% | $738,299 | $177,962 | 374 | |
| 3 | Park Ridge | 41.15 | 9,406 | 3.2% | $845,038 | $171,029 | 276 | |
| 4 | Westfield | 42.40 | 31,111 | 3.6% | $1,269,853 | $232,629 | 572 | |
| 5 | Fair Haven | 42.85 | 6,170 | 4.9% | $1,483,127 | $250,001 | 194 | |
| 6 | Fanwood | 43.20 | 7,799 | 2.7% | $791,728 | $195,529 | 744 | |
| 7 | Oradell | 43.75 | 8,235 | 2.3% | $975,412 | $221,322 | 219 | |
| 8 | Little Silver | 45.30 | 6,105 | 3.3% | $1,110,500 | $240,853 | 622 | |
| 9 | Haddon Heights | 45.40 | 7,516 | 4.5% | $493,148 | $133,125 | 506 | |
| 10 | Norwood | 45.80 | 5,724 | 0.9% | $898,894 | $178,311 | 367 | |
| 11 | Chatham | 45.80 | 9,407 | 5.2% | $1,310,369 | $241,500 | 532 | |
| 12 | Madison | 48.00 | 16,447 | 6.3% | $990,723 | $171,471 | 426 | |
| 13 | Haddonfield | 49.30 | 12,595 | 3.6% | $830,377 | $200,400 | 1,604 | |
| 14 | Franklin Lakes | 49.35 | 11,084 | 2.3% | $1,557,852 | $235,795 | 406 | |
| 15 | Ridgewood | 49.40 | 26,308 | 3.4% | $1,200,489 | $208,211 | 642 | |
| 16 | Emerson | 50.95 | 7,305 | 5.6% | $780,190 | $155,536 | 96 | |
| 17 | New Providence | 51.00 | 13,727 | 3.8% | $990,084 | $161,599 | 299 | |
| 18 | Bernardsville | 51.20 | 7,916 | 4.3% | $1,003,867 | $236,115 | 644 | |
| 19 | Old Tappan | 51.50 | 6,008 | 2.2% | $1,224,145 | $205,385 | 250 | |
| 20 | Glen Rock | 51.80 | 12,154 | 6.0% | $1,056,914 | $215,096 | 642 | |
| 21 | Allendale | 52.80 | 6,865 | 4.1% | $1,073,640 | $160,162 | 117 | |
| 22 | Glen Ridge | 52.85 | 7,943 | 7.6% | $1,125,697 | $250,001 | 1,259 | |
| 23 | North Caldwell | 53.50 | 6,656 | 6.0% | $1,133,696 | $208,245 | 661 | |
| 24 | Rumson | 53.65 | 7,241 | 4.5% | $2,183,827 | $250,001 | 387 | |
| 25 | Mountainside | 53.80 | 7,049 | 3.5% | $1,043,568 | $211,538 | 355 | |
| 26 | Florham Park | 55.10 | 13,564 | 5.4% | $1,025,256 | $158,696 | 664 | |
| 27 | Manasquan | 55.45 | 5,922 | 2.7% | $1,158,873 | $142,944 | 1,047 | |
| 28 | River Edge | 55.60 | 12,091 | 4.7% | $839,655 | $159,028 | 794 | |
| 29 | Point Pleasant | 56.70 | 19,334 | 3.0% | $733,630 | $115,625 | 533 | |
| 30 | Hawthorne | 57.95 | 19,628 | 5.1% | $629,474 | $110,237 | 907 | |
| 31 | Dumont | 58.45 | 18,279 | 3.7% | $666,365 | $126,071 | 312 | |
| 32 | Oakland | 58.65 | 12,768 | 5.4% | $750,020 | $162,019 | 376 | |
| 33 | Woodcliff Lake | 59.15 | 6,152 | 12.0% | $1,228,602 | $213,981 | 748 | |
| 34 | Midland Park | 59.15 | 7,019 | 7.2% | $732,465 | $146,841 | 712 | |
| 35 | Linwood | 59.80 | 6,992 | 7.4% | $487,432 | $156,354 | 729 | |
| 36 | Roseland | 59.85 | 6,268 | 4.9% | $819,880 | $164,458 | 766 | |
| 37 | Tenafly | 60.40 | 15,319 | 6.8% | $1,262,422 | $208,200 | 477 | |
| 38 | New Milford | 60.55 | 16,995 | 6.4% | $727,507 | $114,889 | 506 | |
| 39 | Westwood | 61.55 | 11,283 | 2.5% | $755,182 | $165,781 | 310 | |
| 40 | Wood-Ridge | 62.50 | 10,218 | 4.8% | $709,508 | $136,108 | 617 | |
| 41 | Hasbrouck Heights | 62.90 | 12,115 | 4.4% | $709,659 | $123,734 | 504 | |
| 42 | Closter | 63.35 | 8,606 | 3.3% | $1,153,806 | $190,469 | 1,220 | |
| 43 | Ringwood | 64.25 | 11,657 | 4.8% | $596,571 | $152,414 | 214 | |
| 44 | Morris Plains | 64.60 | 6,315 | 5.0% | $727,186 | $154,923 | 1,283 | |
| 45 | Ramsey | 64.75 | 14,805 | 3.2% | $863,404 | $160,996 | 1,047 | |
| 46 | Kinnelon | 65.95 | 10,013 | 8.1% | $836,759 | $187,438 | 370 | |
| 47 | Leonia | 66.75 | 9,336 | 6.0% | $808,460 | $129,665 | 525 | |
| 48 | Northfield | 67.20 | 8,456 | 3.9% | $388,519 | $111,599 | 1,076 | |
| 49 | Mount Arlington | 67.95 | 5,935 | 3.2% | $529,938 | $92,264 | 152 | |
| 50 | Matawan | 68.50 | 9,710 | 5.1% | $645,512 | $123,354 | 21 | |
| 51 | Fair Lawn | 68.80 | 35,610 | 6.2% | $709,175 | $144,574 | 1,008 | |
| 52 | Metuchen | 69.30 | 15,144 | 5.8% | $683,090 | $158,052 | 1,043 | |
| 53 | Hoboken | 70.10 | 58,668 | 3.8% | $855,399 | $180,579 | 1,926 | |
| 54 | Pitman | 70.15 | 8,856 | 5.4% | $358,956 | $98,489 | 316 | |
| 55 | Audubon | 70.25 | 8,730 | 4.0% | $376,496 | $115,789 | 3,780 | |
| 56 | Rutherford | 70.40 | 18,894 | 4.2% | $738,683 | $143,153 | 879 | |
| 57 | North Haledon | 70.45 | 8,778 | 4.6% | $712,134 | $125,313 | 342 | |
| 58 | Jamesburg | 70.85 | 5,770 | 3.5% | $465,247 | $110,972 | 399 | |
| 59 | Cresskill | 71.05 | 9,174 | 5.2% | $1,000,899 | $170,376 | 4,961 | |
| 60 | Butler | 71.45 | 8,133 | 4.1% | $549,895 | $111,557 | 553 | |
| 61 | Caldwell | 72.30 | 9,003 | 4.4% | $724,635 | $96,824 | 389 | |
| 62 | Boonton | 72.95 | 8,854 | 6.9% | $667,780 | $114,302 | 926 | |
| 63 | Rockaway | 73.20 | 6,613 | 6.4% | $561,517 | $107,053 | 348 | |
| 64 | Oceanport | 73.60 | 6,195 | 7.3% | $910,435 | $126,094 | 420 | |
| 65 | Watchung | 73.70 | 6,485 | 6.1% | $1,060,985 | $173,672 | 4,287 | |
| 66 | Summit | 73.70 | 22,705 | 5.4% | $1,372,011 | $190,304 | 788 | |
| 67 | Montvale | 75.30 | 8,901 | 5.9% | $920,951 | $178,269 | 1,101 | |
| 68 | Roselle Park | 75.65 | 14,093 | 4.8% | $538,084 | $109,679 | 752 | |
| 69 | Englewood Cliffs | 76.80 | 5,362 | 4.8% | $1,733,277 | $230,611 | 1,585 | |
| 70 | Wanaque | 76.85 | 11,206 | 4.0% | $507,937 | $113,175 | 223 | |
| 71 | Somerville | 77.45 | 13,410 | 3.4% | $542,519 | $103,760 | 925 | |
| 72 | Beachwood | 77.80 | 11,088 | 3.1% | $462,369 | $106,858 | 857 | |
| 73 | Raritan | 78.20 | 8,368 | 2.8% | $545,696 | $107,672 | 944 | |
| 74 | Totowa | 78.50 | 10,959 | 3.0% | $659,952 | $113,563 | 2,044 | |
| 75 | West Long Branch | 78.95 | 8,586 | 8.3% | $959,620 | $114,271 | 1,188 | |
| 76 | Bergenfield | 79.00 | 28,450 | 6.2% | $629,539 | $130,045 | 285 | |
| 77 | Upper Saddle River | 79.95 | 8,439 | 7.3% | $1,412,975 | $250,001 | 4,961 | |
| 78 | Woodland Park | 80.55 | 13,355 | 5.6% | $648,176 | $98,845 | 1,063 | |
| 79 | Palisades Park | 81.30 | 20,290 | 5.6% | $987,743 | $94,743 | 720 | |
| 80 | Kenilworth | 81.40 | 8,401 | 6.3% | $625,220 | $118,611 | 869 | |
| 81 | Tinton Falls | 82.25 | 19,361 | 5.8% | $624,719 | $117,308 | 5,405 | |
| 82 | Edgewater | 82.45 | 14,759 | 8.0% | $714,157 | $124,050 | 1,348 | |
| 83 | Union Beach | 83.00 | 5,707 | 7.1% | $527,337 | $119,250 | 5,405 | |
| 84 | South Plainfield | 83.90 | 24,473 | 5.6% | $583,003 | $130,239 | 2,059 | |
| 85 | Maywood | 84.40 | 10,093 | 8.1% | $681,177 | $117,912 | 1,565 | |
| 86 | Ridgefield | 84.60 | 11,498 | 5.6% | $778,380 | $118,059 | 774 | |
| 87 | Paramus | 85.45 | 26,568 | 7.7% | $1,039,757 | $144,349 | 4,961 | |
| 88 | Highland Park | 85.55 | 15,121 | 4.8% | $585,369 | $104,694 | 1,382 | |
| 89 | Brigantine | 85.70 | 7,674 | 5.7% | $697,787 | $97,250 | 847 | |
| 90 | Hopatcong | 86.20 | 14,565 | 2.9% | $447,232 | $115,758 | 254 | |
| 91 | Berlin | 86.75 | 7,539 | 2.1% | $389,297 | $102,855 | 1,326 | |
| 92 | Barrington | 88.20 | 7,076 | 4.7% | $364,664 | $87,290 | 1,215 | |
| 93 | Lincoln Park | 89.85 | 10,957 | 10.1% | $534,178 | $123,397 | 639 | |
| 94 | Carlstadt | 91.60 | 6,378 | 7.5% | $656,613 | $115,444 | 1,646 | |
| 95 | Fort Lee | 91.60 | 40,067 | 5.8% | $588,321 | $107,274 | 1,243 | |
| 96 | Bogota | 91.70 | 9,360 | 7.1% | $605,189 | $103,299 | 545 | |
| 97 | Pompton Lakes | 92.05 | 11,047 | 3.1% | $548,025 | $124,454 | 3,333 | |
| 98 | Bloomingdale | 93.85 | 7,716 | 3.6% | $547,974 | $127,500 | 505 | |
| 99 | Manville | 94.05 | 10,921 | 3.1% | $476,361 | $93,333 | 1,071 | |
| 100 | Cliffside Park | 94.80 | 25,781 | 4.4% | $645,671 | $93,452 | 780 |
Source: U.S. Census ACS 2020-2024, FBI UCR, Zillow research. 177 places with more than 5,000 residents.
Summary
Summary: The Best Places In New Jersey
If you’re looking at areas in New Jersey with the best economic situations, where there’s lower than average crime, and a lot to do, this is an accurate list.
The best places to live in New Jersey are Hillsdale, Waldwick, Park Ridge, Westfield, Fair Haven, Fanwood, Oradell, Little Silver, Haddon Heights, and Norwood.
Hillsdale made a strong showing to take in the overall number one spot for the best place to live in New Jersey for 2026.