Elizabeth SnackAbility
Overall SnackAbility
Crime in Elizabeth summary. We use data from the FBI to determine the crime rates in Elizabeth. Key points include:
There were 4,247 total crimes in Elizabeth in the last reporting year.
The overall crime rate per 100,000 people in Elizabeth is 3,066.4 / 100k people.
The violent crime rate per 100,000 people in Elizabeth is 408.7 / 100k people.
The property crime rate per 100,000 people in Elizabeth is 2,657.8 / 100k people.
Overall, crime in Elizabeth is 44.70% above the national average.
Total Crimes
Above National Average
Crime In Elizabeth Comparison Table
| Statistic | Count Raw |
Elizabeth / 100k People |
New Jersey / 100k People |
National / 100k People |
|---|---|---|---|---|
| Total Crimes Per 100K | 4,247 | 3,066.4 | 1,645.1 | 2,119.2 |
| Violent Crime | 566 | 408.7 | 217.7 | 359.0 |
| Murder | 5 | 3.6 | 2.3 | 5.0 |
| Robbery | 156 | 112.6 | 49.3 | 61.0 |
| Aggravated Assault | 361 | 260.6 | 148.8 | 256.0 |
| Property Crime | 3,681 | 2,657.8 | 1,427.3 | 1,760.0 |
| Burglary | 205 | 148.0 | 145.3 | 229.0 |
| Larceny | 2,643 | 1,908.3 | 1,119.4 | 1,272.0 |
| Car Theft | 833 | 601.4 | 162.6 | 259.0 |
Source: FBI Uniform Crime Reporting (2024)
Cost of living in Elizabeth summary. We use data on the cost of living to determine how expensive it is to live in Elizabeth. Real estate prices drive most of the variance in cost of living around New Jersey. Key points include:
The cost of living in Elizabeth is 125 with 100 being average.
The cost of living in Elizabeth is 1.2x higher than the national average.
The median home value in Elizabeth is $534,666.
The median income in Elizabeth is $66,555.
Elizabeth's Overall Cost Of Living
Higher Than The National Average
Cost Of Living In Elizabeth Comparison Table
| Living Expense | Elizabeth | New Jersey | National Average |
|---|---|---|---|
| Overall | 125 | 125 | 100 |
| Services | 111 | 107 | 100 |
| Groceries | 113 | 113 | 100 |
| Health | 154 | 155 | 100 |
| Housing | 116 | 116 | 100 |
| Transportation | 119 | 112 | 100 |
| Utilities | 113 | 113 | 100 |
Source: Cost of living index, normalized to US average = 100
Elizabeth, NJ Weather
The average high in Elizabeth is 63.6° and the average low is 45.5°.
There are 75.7 days of precipitation each year.
Expect an average of 48.3 inches of precipitation each year with 26.7 inches of snow.
| Stat | Elizabeth |
|---|---|
| Average Annual High | 63.6 |
| Average Annual Low | 45.5 |
| Annual Precipitation Days | 75.7 |
| Average Annual Precipitation | 48.3 |
| Average Annual Snowfall | 26.7 |
Average High
Days of Rain
Source: NOAA climate normals (30-year)
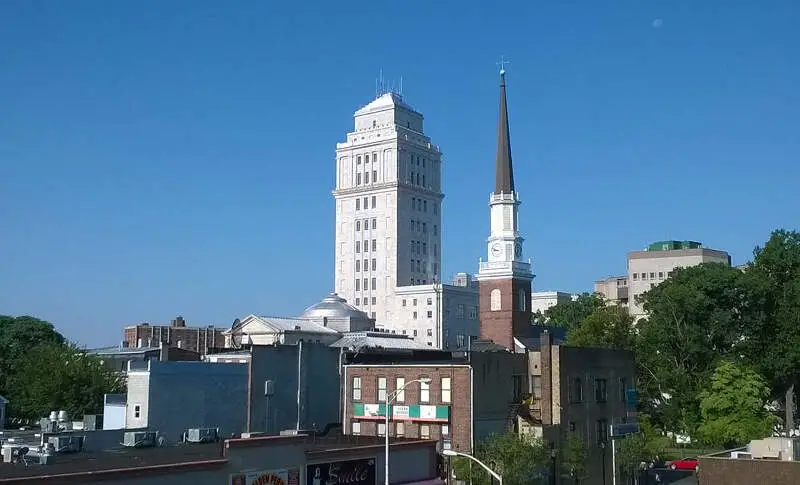
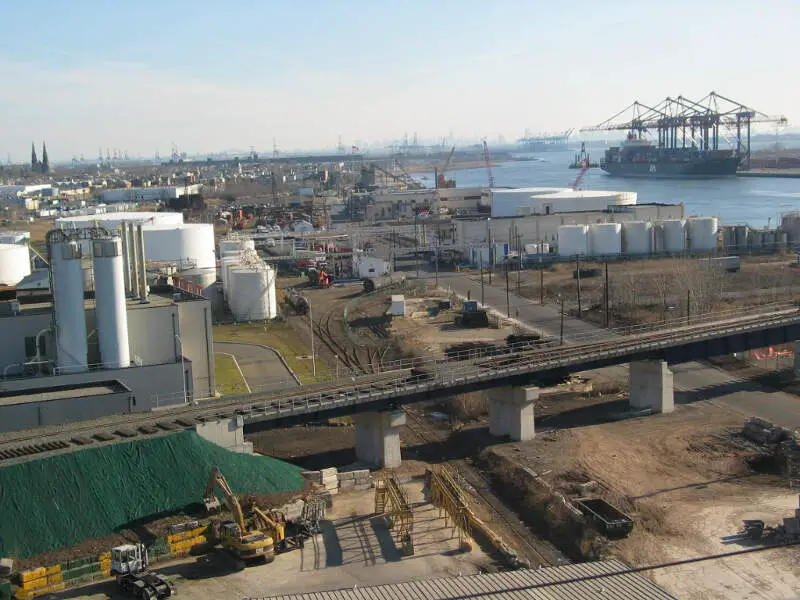
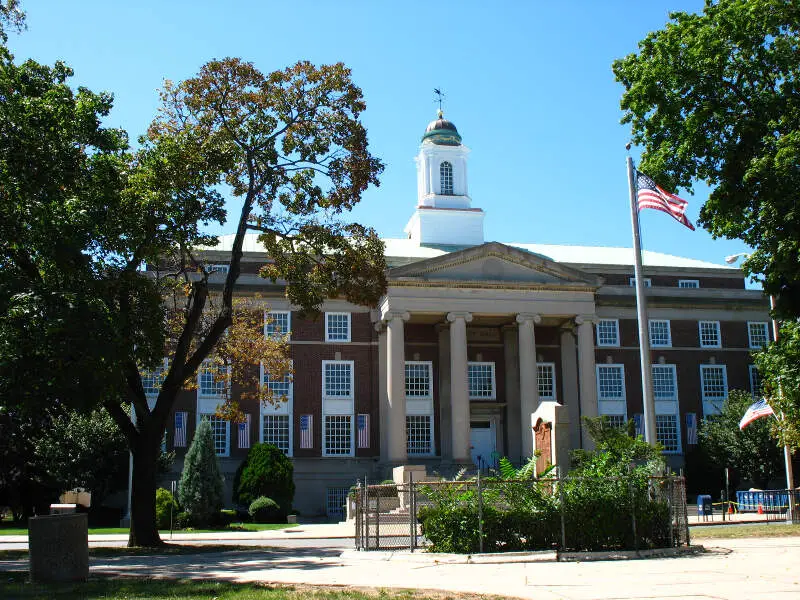
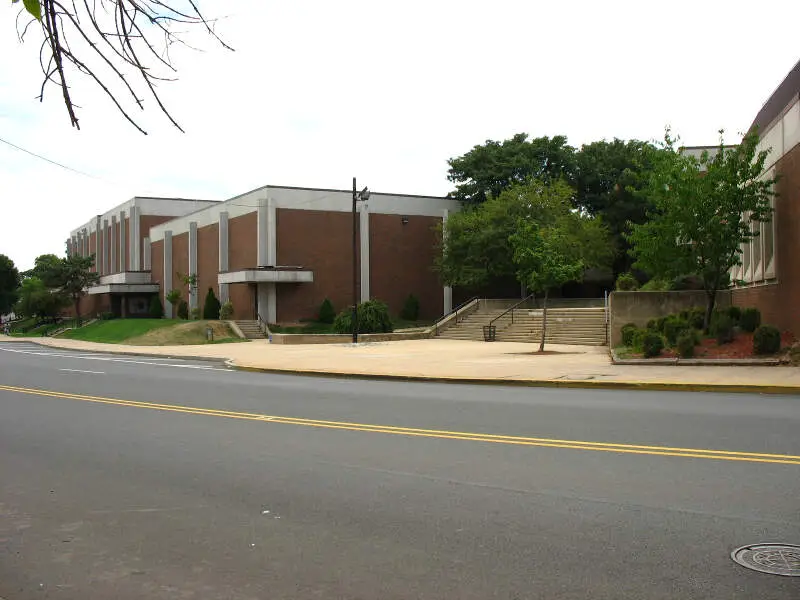
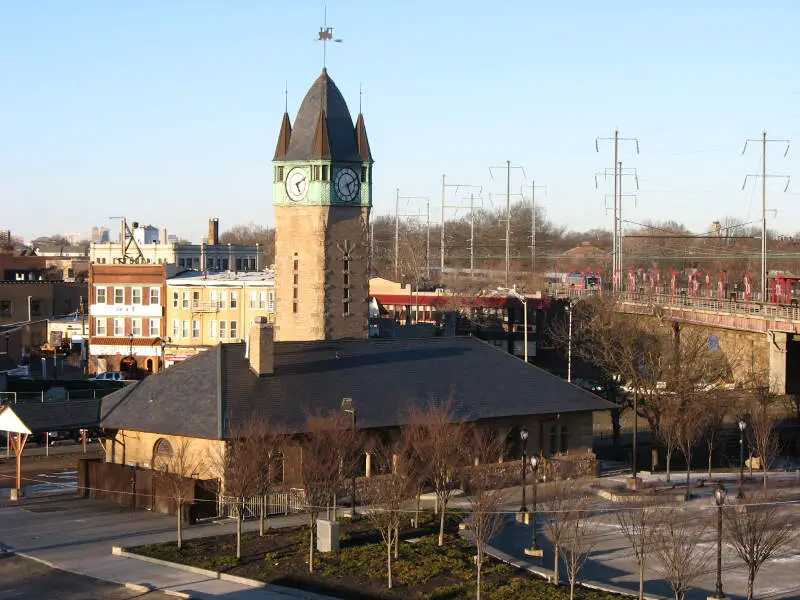
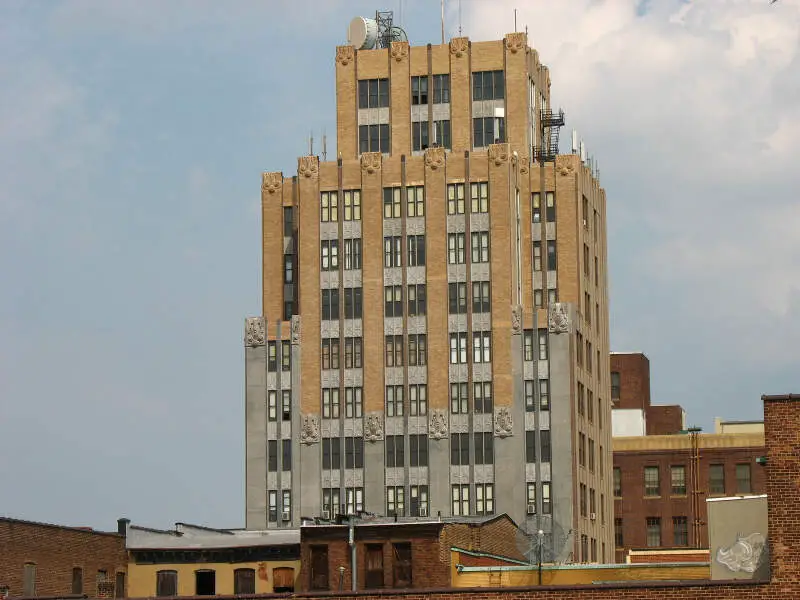
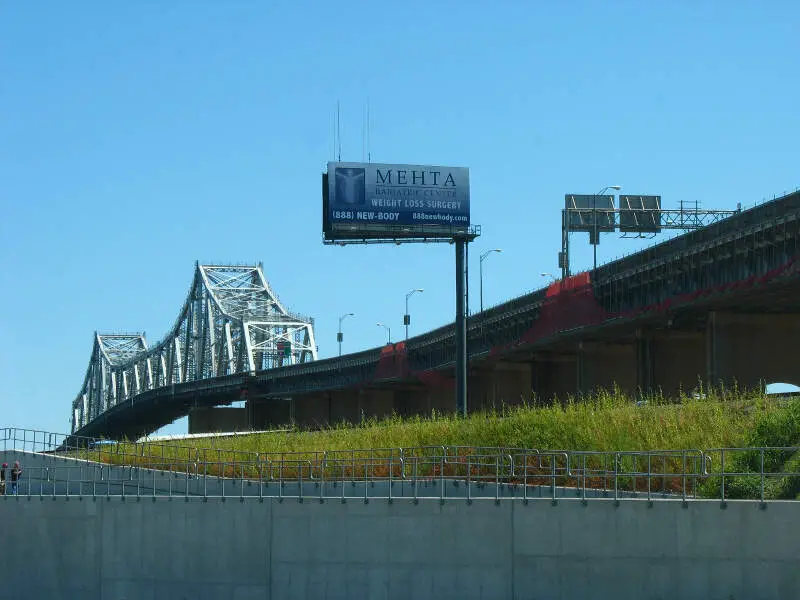
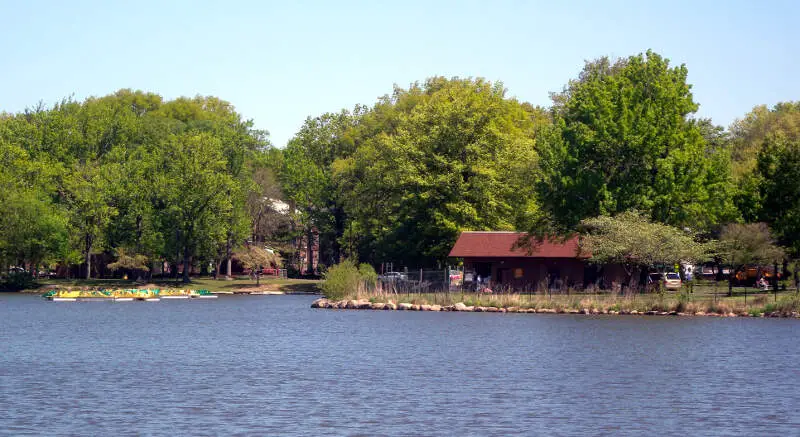
Elizabeth, NJ Photos

2 Reviews & Comments About Elizabeth

Elizabeth New Jersey is a dump from what I have seen. Although this area I live in is allegedly one of the best places to live in the United States, I disagree.
I Live In Elizabeth, NJ Currently Here Right Now & Right About Now The Beef Is Getting Bad Here. BUT ELIZABETH, NEWARK, EO, IRVINGTON & ETC SHOULD BE ON HERE DEFINITELY.
Rankings & Articles For Elizabeth


Locations Around Elizabeth
Map Of Elizabeth, NJ
Best Places Around Elizabeth
Lincoln Park, NJ
Population 10,957
Florham Park, NJ
Population 13,564
Hasbrouck Heights, NJ
Population 12,115
Westfield, NJ
Population 31,111
Boonton, NJ
Population 8,854
Wood-Ridge, NJ
Population 10,218
Middlesex, NJ
Population 14,645
Leonia, NJ
Population 9,336
Mountainside, NJ
Population 7,049
Morris Plains, NJ
Population 6,315
Elizabeth Demographics And Statistics
Population over time in Elizabeth
The current population in Elizabeth is 137,302. The population has increased 11.5% from 2010.
| Year | Population | % Change |
|---|---|---|
| 2024 | 137,302 | 1.0% |
| 2023 | 135,887 | 0.2% |
| 2022 | 135,665 | -0.1% |
| 2021 | 135,772 | 5.7% |
| 2020 | 128,484 | 0.1% |
| 2019 | 128,333 | 0.1% |
| 2018 | 128,153 | -0.9% |
| 2017 | 129,363 | 1.0% |
| 2016 | 128,042 | 0.2% |
| 2015 | 127,759 | 0.6% |
| 2014 | 126,964 | 0.9% |
| 2013 | 125,888 | 0.9% |
| 2012 | 124,795 | 0.7% |
| 2011 | 123,905 | 0.6% |
| 2010 | 123,176 | - |
Race / Ethnicity in Elizabeth
See the full breakdown
Elizabeth is:
12.1% White with 16,552 White residents.
14.6% African American with 20,002 African American residents.
0.0% American Indian with 23 American Indian residents.
1.7% Asian with 2,366 Asian residents.
0.0% Hawaiian with 7 Hawaiian residents.
1.1% Other with 1,455 Other residents.
3.2% Two Or More with 4,354 Two Or More residents.
67.4% Hispanic with 92,543 Hispanic residents.
| Race | Elizabeth | NJ | USA |
|---|---|---|---|
| White | 12.1% | 50.9% | 57.4% |
| African American | 14.6% | 12.2% | 11.9% |
| American Indian | 0.0% | 0.1% | 0.5% |
| Asian | 1.7% | 10.0% | 5.9% |
| Hawaiian | 0.0% | 0.0% | 0.2% |
| Other | 1.1% | 0.8% | 0.6% |
| Two Or More | 3.2% | 3.5% | 4.3% |
| Hispanic | 67.4% | 22.5% | 19.3% |
Gender in Elizabeth
See the full breakdown
Elizabeth is 49.9% female with 68,567 female residents.
Elizabeth is 50.1% male with 68,734 male residents.
| Gender | Elizabeth | NJ | USA |
|---|---|---|---|
| Female | 49.9% | 50.8% | 50.5% |
| Male | 50.1% | 49.2% | 49.5% |
Highest level of educational attainment in Elizabeth for adults over 25
See the full breakdown
15.0% of adults in Elizabeth completed < 9th grade.
11.0% of adults in Elizabeth completed 9-12th grade.
37.0% of adults in Elizabeth completed high school / ged.
18.0% of adults in Elizabeth completed some college.
5.0% of adults in Elizabeth completed associate's degree.
10.0% of adults in Elizabeth completed bachelor's degree.
3.0% of adults in Elizabeth completed master's degree.
1.0% of adults in Elizabeth completed professional degree.
0.0% of adults in Elizabeth completed doctorate degree.
| Education | Elizabeth | NJ | USA |
|---|---|---|---|
| < 9th Grade | 15.0% | 4.0% | 4.0% |
| 9-12th Grade | 11.0% | 5.0% | 6.0% |
| High School / GED | 37.0% | 25.0% | 26.0% |
| Some College | 18.0% | 15.0% | 19.0% |
| Associate's Degree | 5.0% | 7.0% | 9.0% |
| Bachelor's Degree | 10.0% | 26.0% | 22.0% |
| Master's Degree | 3.0% | 13.0% | 10.0% |
| Professional Degree | 1.0% | 3.0% | 2.0% |
| Doctorate Degree | 0.0% | 2.0% | 2.0% |
Household Income For Elizabeth, New Jersey
See the full breakdown
4.8% of households in Elizabeth earn Less than $10,000.
5.0% of households in Elizabeth earn $10,000 to $14,999.
6.4% of households in Elizabeth earn $15,000 to $24,999.
8.4% of households in Elizabeth earn $25,000 to $34,999.
13.7% of households in Elizabeth earn $35,000 to $49,999.
17.2% of households in Elizabeth earn $50,000 to $74,999.
15.6% of households in Elizabeth earn $75,000 to $99,999.
14.2% of households in Elizabeth earn $100,000 to $149,999.
7.4% of households in Elizabeth earn $150,000 to $199,999.
7.3% of households in Elizabeth earn $200,000 or more.
| Income | Elizabeth | NJ | USA |
|---|---|---|---|
| Less than $10,000 | 4.8% | 4.1% | 5.0% |
| $10,000 to $14,999 | 5.0% | 2.7% | 3.4% |
| $15,000 to $24,999 | 6.4% | 4.8% | 6.3% |
| $25,000 to $34,999 | 8.4% | 5.1% | 6.6% |
| $35,000 to $49,999 | 13.7% | 7.6% | 10.1% |
| $50,000 to $74,999 | 17.2% | 12.8% | 15.5% |
| $75,000 to $99,999 | 15.6% | 11.3% | 12.6% |
| $100,000 to $149,999 | 14.2% | 18.1% | 17.5% |
| $150,000 to $199,999 | 7.4% | 11.8% | 9.6% |
| $200,000 or more | 7.3% | 21.6% | 13.4% |
Source: U.S. Census ACS 5-year estimates (2024)


