Trenton SnackAbility
Overall SnackAbility
Crime in Trenton summary. We use data from the FBI to determine the crime rates in Trenton. Key points include:
There were 3,024 total crimes in Trenton in the last reporting year.
The overall crime rate per 100,000 people in Trenton is 3,314.5 / 100k people.
The violent crime rate per 100,000 people in Trenton is 1,025.9 / 100k people.
The property crime rate per 100,000 people in Trenton is 2,288.6 / 100k people.
Overall, crime in Trenton is 56.40% above the national average.
Total Crimes
Above National Average
Crime In Trenton Comparison Table
| Statistic | Count Raw |
Trenton / 100k People |
New Jersey / 100k People |
National / 100k People |
|---|---|---|---|---|
| Total Crimes Per 100K | 3,024 | 3,314.5 | 1,645.1 | 2,119.2 |
| Violent Crime | 936 | 1,025.9 | 217.7 | 359.0 |
| Murder | 20 | 21.9 | 2.3 | 5.0 |
| Robbery | 334 | 366.1 | 49.3 | 61.0 |
| Aggravated Assault | 529 | 579.8 | 148.8 | 256.0 |
| Property Crime | 2,088 | 2,288.6 | 1,427.3 | 1,760.0 |
| Burglary | 317 | 347.5 | 145.3 | 229.0 |
| Larceny | 1,322 | 1,449.0 | 1,119.4 | 1,272.0 |
| Car Theft | 449 | 492.1 | 162.6 | 259.0 |
Source: FBI Uniform Crime Reporting (2024)
Cost of living in Trenton summary. We use data on the cost of living to determine how expensive it is to live in Trenton. Real estate prices drive most of the variance in cost of living around New Jersey. Key points include:
The cost of living in Trenton is 100 with 100 being average.
The cost of living in Trenton is 1.0x lower than the national average.
The median home value in Trenton is $345,375.
The median income in Trenton is $52,537.
Trenton's Overall Cost Of Living
Lower Than The National Average
Cost Of Living In Trenton Comparison Table
| Living Expense | Trenton | New Jersey | National Average |
|---|---|---|---|
| Overall | 100 | 125 | 100 |
| Services | 107 | 107 | 100 |
| Groceries | 117 | 113 | 100 |
| Health | 73 | 155 | 100 |
| Housing | 113 | 116 | 100 |
| Transportation | 112 | 112 | 100 |
| Utilities | 108 | 113 | 100 |
Source: Cost of living index, normalized to US average = 100
Trenton, NJ Weather
The average high in Trenton is 64.2° and the average low is 44.1°.
There are 77.6 days of precipitation each year.
Expect an average of 48.3 inches of precipitation each year with 20.6 inches of snow.
| Stat | Trenton |
|---|---|
| Average Annual High | 64.2 |
| Average Annual Low | 44.1 |
| Annual Precipitation Days | 77.6 |
| Average Annual Precipitation | 48.3 |
| Average Annual Snowfall | 20.6 |
Average High
Days of Rain
Source: NOAA climate normals (30-year)
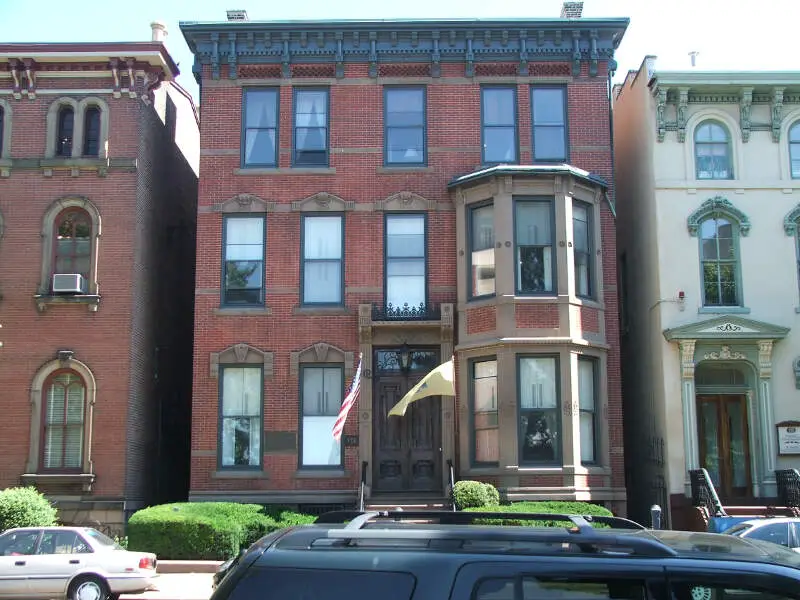
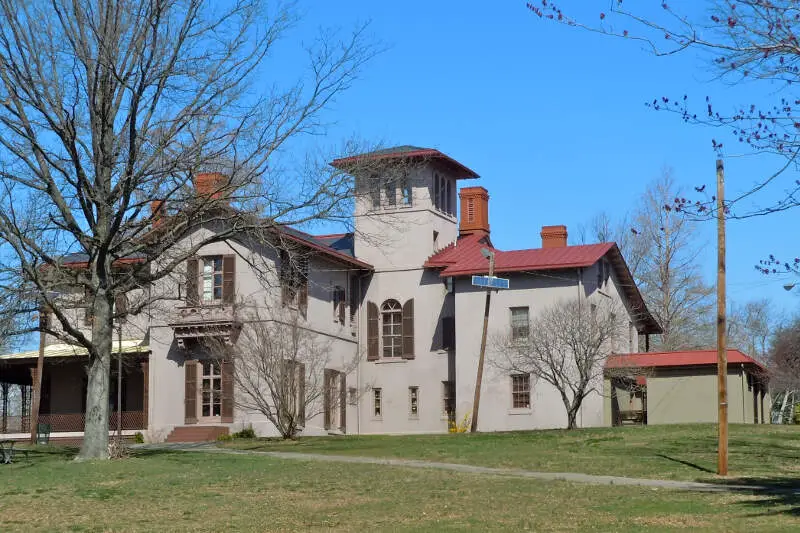
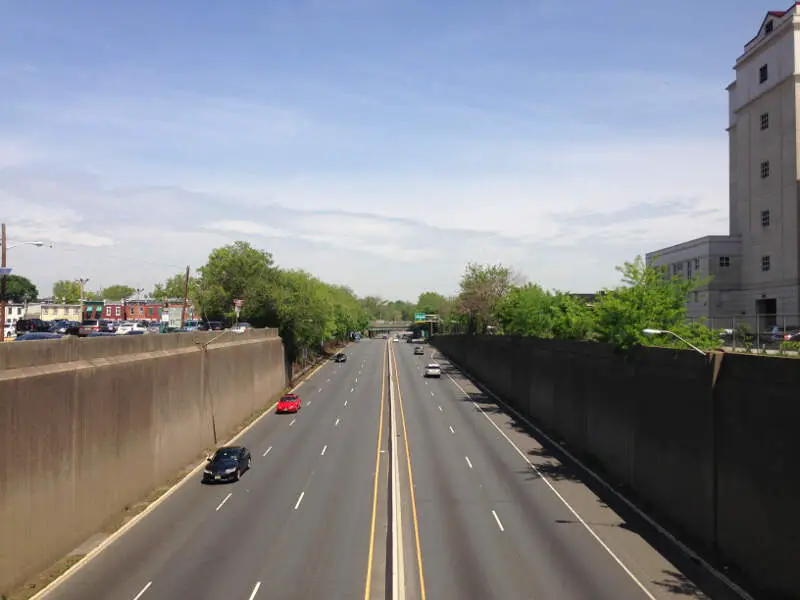
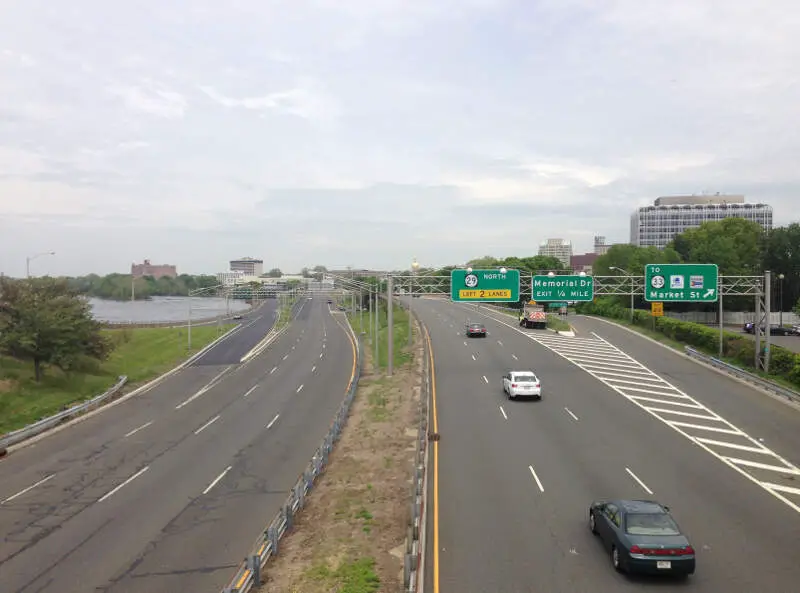
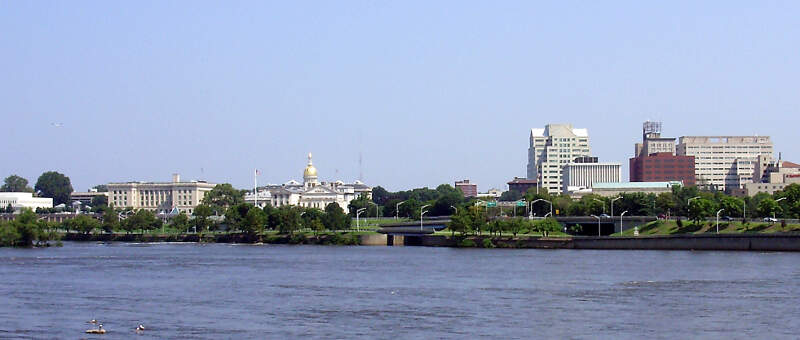
Trenton, NJ Photos


3 Reviews & Comments About Trenton

Lol i was born in jersey and my family lives in Trenton we moved but we went to visit I saw the state prison everyday lol I loved it there I like that it's ghetto
I live in Trenton and I live in a beautiful neighborhood
I grew up in Trenton. It was close to everything, malls, food, and shops. You name it! We kept our doors unlocked and everyone knew their neighbor. It wasn't a very rich city but people were friendly and there was low crime. Fast forward to today, 39 years later, things are a lot different. Shops are closed, crime is high, streets a loaded with trash and everyone is fighting each other. No one goes to Trenton anymore.
I wouldn't recommend a trip to Trenton unless you are visiting relatives or have an appointment during the day with a business. Bullets are always crossing the streets from gang fights. I'd recommend going else where.
Rankings & Articles For Trenton


Locations Around Trenton
Map Of Trenton, NJ
Best Places Around Trenton
Hamilton Square, NJ
Population 11,622
Yardville, NJ
Population 6,301
Mercerville, NJ
Population 13,535
White Horse, NJ
Population 10,507
Twin Rivers, NJ
Population 8,382
Fort Dix, NJ
Population 7,984
Hatboro, PA
Population 8,283
Levittown, PA
Population 50,926
Kendall Park, NJ
Population 10,011
Willow Grove, PA
Population 14,131
Trenton Demographics And Statistics
Population over time in Trenton
The current population in Trenton is 90,338. The population has increased 6.1% from 2010.
| Year | Population | % Change |
|---|---|---|
| 2024 | 90,338 | 0.4% |
| 2023 | 89,966 | -0.1% |
| 2022 | 90,055 | -0.0% |
| 2021 | 90,097 | 8.0% |
| 2020 | 83,387 | -0.0% |
| 2019 | 83,412 | -0.4% |
| 2018 | 83,734 | -1.3% |
| 2017 | 84,867 | 0.4% |
| 2016 | 84,559 | -0.1% |
| 2015 | 84,632 | 0.2% |
| 2014 | 84,459 | -0.2% |
| 2013 | 84,609 | -0.2% |
| 2012 | 84,799 | -0.3% |
| 2011 | 85,044 | -0.2% |
| 2010 | 85,181 | - |
Race / Ethnicity in Trenton
See the full breakdown
Trenton is:
10.6% White with 9,573 White residents.
40.0% African American with 36,163 African American residents.
0.0% American Indian with 31 American Indian residents.
0.4% Asian with 386 Asian residents.
0.0% Hawaiian with 0 Hawaiian residents.
0.2% Other with 160 Other residents.
2.4% Two Or More with 2,135 Two Or More residents.
46.4% Hispanic with 41,890 Hispanic residents.
| Race | Trenton | NJ | USA |
|---|---|---|---|
| White | 10.6% | 50.9% | 57.4% |
| African American | 40.0% | 12.2% | 11.9% |
| American Indian | 0.0% | 0.1% | 0.5% |
| Asian | 0.4% | 10.0% | 5.9% |
| Hawaiian | 0.0% | 0.0% | 0.2% |
| Other | 0.2% | 0.8% | 0.6% |
| Two Or More | 2.4% | 3.5% | 4.3% |
| Hispanic | 46.4% | 22.5% | 19.3% |
Gender in Trenton
See the full breakdown
Trenton is 50.1% female with 45,288 female residents.
Trenton is 49.9% male with 45,050 male residents.
| Gender | Trenton | NJ | USA |
|---|---|---|---|
| Female | 50.1% | 50.8% | 50.5% |
| Male | 49.9% | 49.2% | 49.5% |
Highest level of educational attainment in Trenton for adults over 25
See the full breakdown
12.0% of adults in Trenton completed < 9th grade.
12.0% of adults in Trenton completed 9-12th grade.
38.0% of adults in Trenton completed high school / ged.
16.0% of adults in Trenton completed some college.
5.0% of adults in Trenton completed associate's degree.
11.0% of adults in Trenton completed bachelor's degree.
4.0% of adults in Trenton completed master's degree.
1.0% of adults in Trenton completed professional degree.
1.0% of adults in Trenton completed doctorate degree.
| Education | Trenton | NJ | USA |
|---|---|---|---|
| < 9th Grade | 12.0% | 4.0% | 4.0% |
| 9-12th Grade | 12.0% | 5.0% | 6.0% |
| High School / GED | 38.0% | 25.0% | 26.0% |
| Some College | 16.0% | 15.0% | 19.0% |
| Associate's Degree | 5.0% | 7.0% | 9.0% |
| Bachelor's Degree | 11.0% | 26.0% | 22.0% |
| Master's Degree | 4.0% | 13.0% | 10.0% |
| Professional Degree | 1.0% | 3.0% | 2.0% |
| Doctorate Degree | 1.0% | 2.0% | 2.0% |
Household Income For Trenton, New Jersey
See the full breakdown
11.6% of households in Trenton earn Less than $10,000.
6.3% of households in Trenton earn $10,000 to $14,999.
8.0% of households in Trenton earn $15,000 to $24,999.
9.2% of households in Trenton earn $25,000 to $34,999.
13.2% of households in Trenton earn $35,000 to $49,999.
15.0% of households in Trenton earn $50,000 to $74,999.
13.1% of households in Trenton earn $75,000 to $99,999.
14.2% of households in Trenton earn $100,000 to $149,999.
4.7% of households in Trenton earn $150,000 to $199,999.
4.7% of households in Trenton earn $200,000 or more.
| Income | Trenton | NJ | USA |
|---|---|---|---|
| Less than $10,000 | 11.6% | 4.1% | 5.0% |
| $10,000 to $14,999 | 6.3% | 2.7% | 3.4% |
| $15,000 to $24,999 | 8.0% | 4.8% | 6.3% |
| $25,000 to $34,999 | 9.2% | 5.1% | 6.6% |
| $35,000 to $49,999 | 13.2% | 7.6% | 10.1% |
| $50,000 to $74,999 | 15.0% | 12.8% | 15.5% |
| $75,000 to $99,999 | 13.1% | 11.3% | 12.6% |
| $100,000 to $149,999 | 14.2% | 18.1% | 17.5% |
| $150,000 to $199,999 | 4.7% | 11.8% | 9.6% |
| $200,000 or more | 4.7% | 21.6% | 13.4% |
Source: U.S. Census ACS 5-year estimates (2024)


