Bronxville SnackAbility
Overall SnackAbility
Cost of living in Bronxville summary. We use data on the cost of living to determine how expensive it is to live in Bronxville. Real estate prices drive most of the variance in cost of living around New York. Key points include:
The cost of living in Bronxville is 235 with 100 being average.
The cost of living in Bronxville is 2.4x higher than the national average.
The median home value in Bronxville is $1,450,320.
The median income in Bronxville is $215,815.
Bronxville's Overall Cost Of Living
Higher Than The National Average
Cost Of Living In Bronxville Comparison Table
| Living Expense | Bronxville | New York | National Average |
|---|---|---|---|
| Overall | 235 | 121 | 100 |
| Services | 111 | 105 | 100 |
| Groceries | 108 | 108 | 100 |
| Health | 521 | 143 | 100 |
| Housing | 117 | 112 | 100 |
| Transportation | 109 | 114 | 100 |
| Utilities | 108 | 111 | 100 |
Source: Cost of living index, normalized to US average = 100
Bronxville, NY Weather
The average high in Bronxville is 61.5° and the average low is 43.4°.
There are 80.5 days of precipitation each year.
Expect an average of 48.7 inches of precipitation each year with 32.9 inches of snow.
| Stat | Bronxville |
|---|---|
| Average Annual High | 61.5 |
| Average Annual Low | 43.4 |
| Annual Precipitation Days | 80.5 |
| Average Annual Precipitation | 48.7 |
| Average Annual Snowfall | 32.9 |
Average High
Days of Rain
Source: NOAA climate normals (30-year)
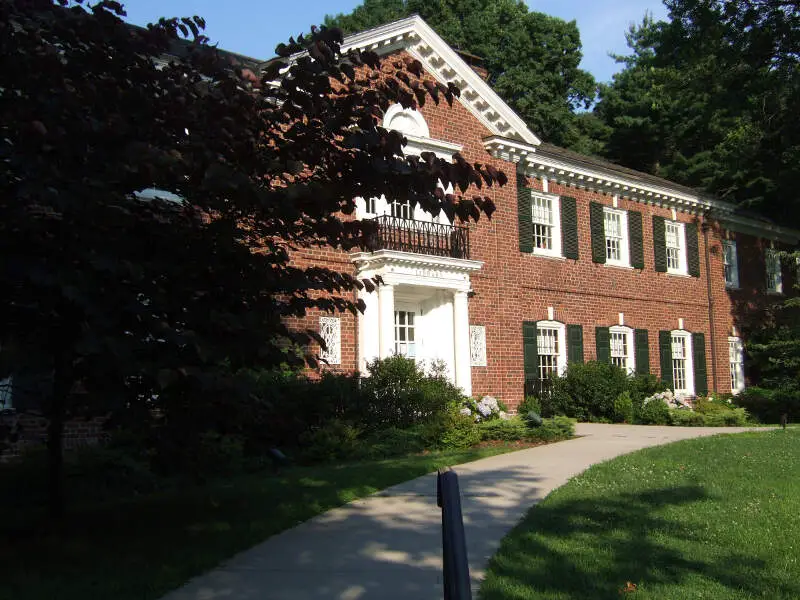
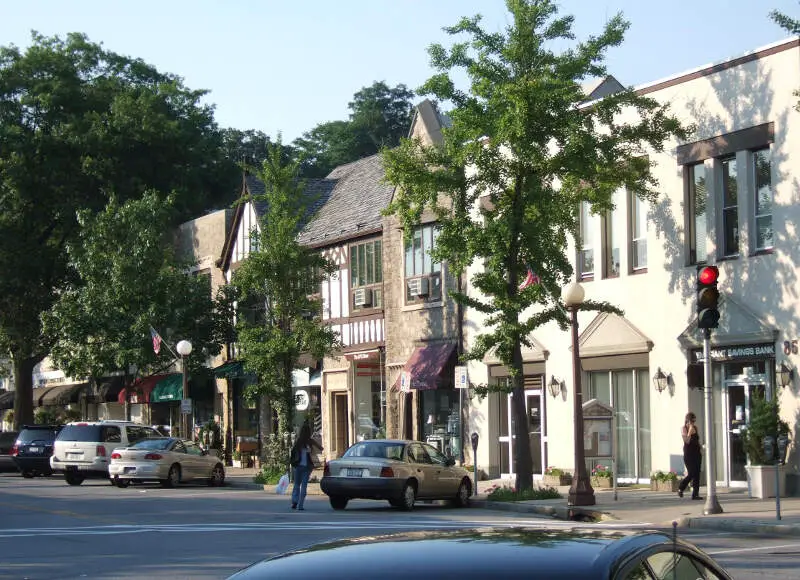
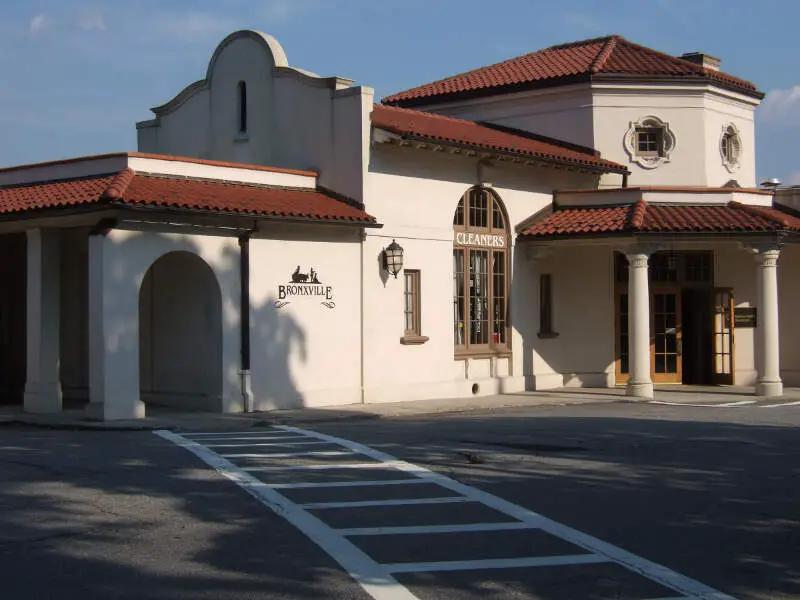
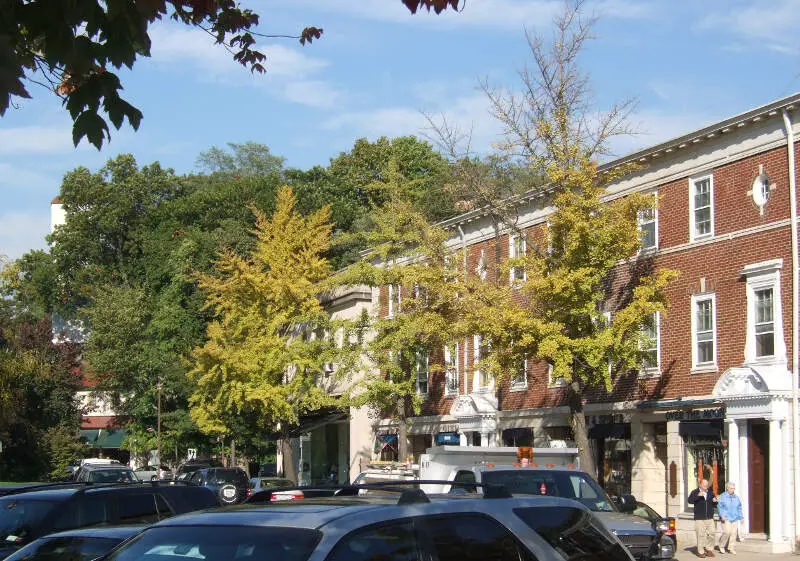
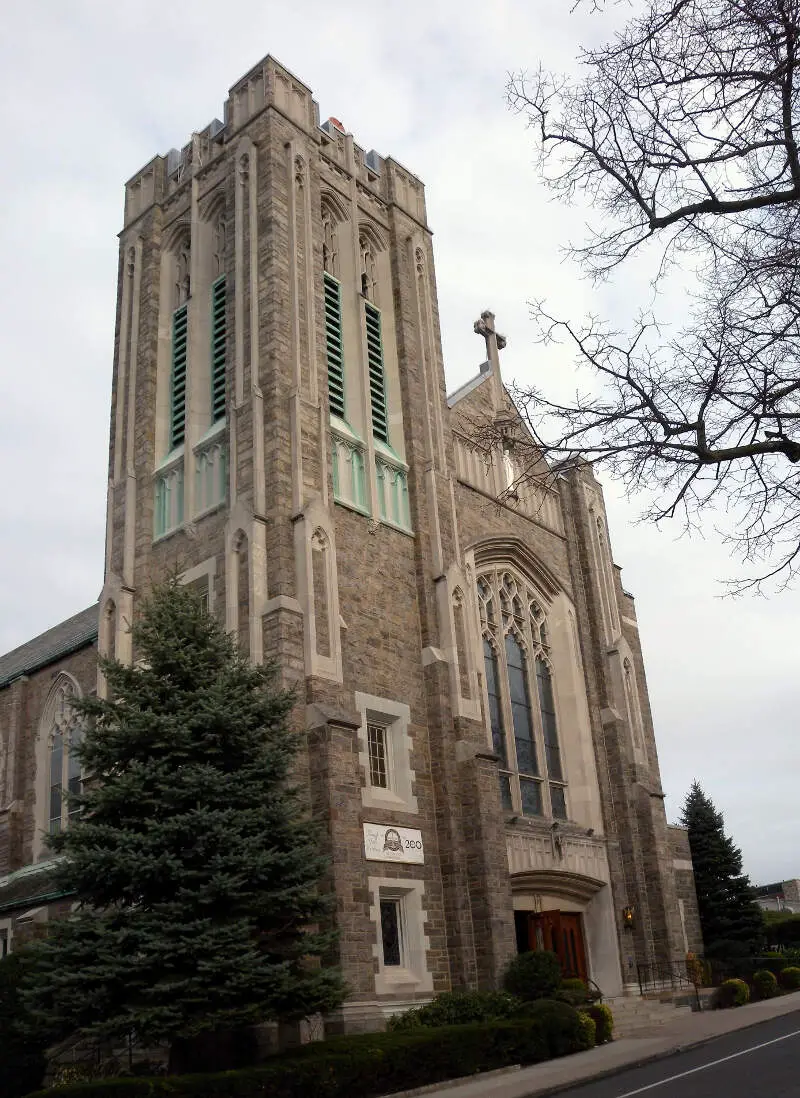
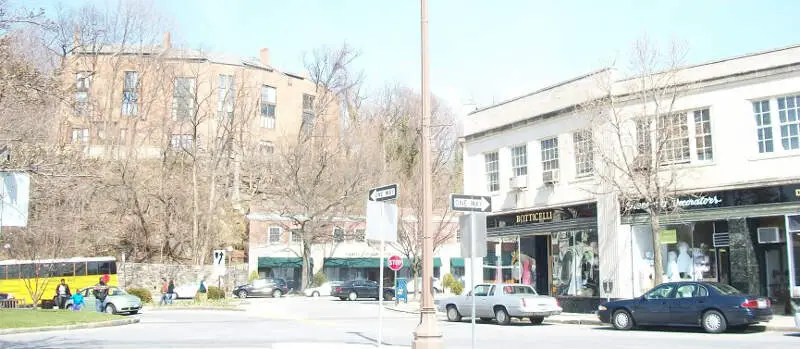
Bronxville, NY Photos


1 Reviews & Comments About Bronxville

The crime rate is bad. And everyone is rude.
I dont like how people are and how disrespectful they are.
Rankings & Articles For Bronxville


Locations Around Bronxville
Map Of Bronxville, NY
Best Places Around Bronxville
Malverne, NY
Population 8,477
Syosset, NY
Population 18,433
Pelham Manor, NY
Population 5,644
North New Hyde Park, NY
Population 14,159
Jericho, NY
Population 13,759
East Hills, NY
Population 7,257
Pleasantville, NY
Population 7,371
Larchmont, NY
Population 6,567
Williston Park, NY
Population 7,542
Briarcliff Manor, NY
Population 7,519
Bronxville Demographics And Statistics
Population over time in Bronxville
The current population in Bronxville is 6,510. The population has increased 2.9% from 2010.
| Year | Population | % Change |
|---|---|---|
| 2024 | 6,510 | -0.4% |
| 2023 | 6,539 | -0.5% |
| 2022 | 6,570 | 0.0% |
| 2021 | 6,569 | 1.8% |
| 2020 | 6,450 | 0.6% |
| 2019 | 6,409 | 0.2% |
| 2018 | 6,394 | -0.5% |
| 2017 | 6,428 | 0.5% |
| 2016 | 6,395 | -0.2% |
| 2015 | 6,409 | 0.5% |
| 2014 | 6,378 | 0.4% |
| 2013 | 6,352 | 0.1% |
| 2012 | 6,345 | 0.4% |
| 2011 | 6,322 | -0.1% |
| 2010 | 6,329 | - |
Race / Ethnicity in Bronxville
See the full breakdown
Bronxville is:
78.2% White with 5,094 White residents.
0.5% African American with 31 African American residents.
0.0% American Indian with 0 American Indian residents.
5.6% Asian with 367 Asian residents.
0.0% Hawaiian with 0 Hawaiian residents.
0.3% Other with 18 Other residents.
5.2% Two Or More with 341 Two Or More residents.
10.1% Hispanic with 659 Hispanic residents.
| Race | Bronxville | NY | USA |
|---|---|---|---|
| White | 78.2% | 52.8% | 57.4% |
| African American | 0.5% | 13.4% | 11.9% |
| American Indian | 0.0% | 0.2% | 0.5% |
| Asian | 5.6% | 9.0% | 5.9% |
| Hawaiian | 0.0% | 0.0% | 0.2% |
| Other | 0.3% | 1.0% | 0.6% |
| Two Or More | 5.2% | 3.8% | 4.3% |
| Hispanic | 10.1% | 19.8% | 19.3% |
Gender in Bronxville
See the full breakdown
Bronxville is 51.2% female with 3,332 female residents.
Bronxville is 48.8% male with 3,178 male residents.
| Gender | Bronxville | NY | USA |
|---|---|---|---|
| Female | 51.2% | 51.2% | 50.5% |
| Male | 48.8% | 48.8% | 49.5% |
Highest level of educational attainment in Bronxville for adults over 25
See the full breakdown
1.0% of adults in Bronxville completed < 9th grade.
1.0% of adults in Bronxville completed 9-12th grade.
5.0% of adults in Bronxville completed high school / ged.
12.0% of adults in Bronxville completed some college.
2.0% of adults in Bronxville completed associate's degree.
38.0% of adults in Bronxville completed bachelor's degree.
24.0% of adults in Bronxville completed master's degree.
13.0% of adults in Bronxville completed professional degree.
4.0% of adults in Bronxville completed doctorate degree.
| Education | Bronxville | NY | USA |
|---|---|---|---|
| < 9th Grade | 1.0% | 6.0% | 4.0% |
| 9-12th Grade | 1.0% | 6.0% | 6.0% |
| High School / GED | 5.0% | 24.0% | 26.0% |
| Some College | 12.0% | 15.0% | 19.0% |
| Associate's Degree | 2.0% | 9.0% | 9.0% |
| Bachelor's Degree | 38.0% | 22.0% | 22.0% |
| Master's Degree | 24.0% | 13.0% | 10.0% |
| Professional Degree | 13.0% | 3.0% | 2.0% |
| Doctorate Degree | 4.0% | 2.0% | 2.0% |
Household Income For Bronxville, New York
See the full breakdown
0.8% of households in Bronxville earn Less than $10,000.
0.0% of households in Bronxville earn $10,000 to $14,999.
6.1% of households in Bronxville earn $15,000 to $24,999.
0.6% of households in Bronxville earn $25,000 to $34,999.
2.2% of households in Bronxville earn $35,000 to $49,999.
4.6% of households in Bronxville earn $50,000 to $74,999.
5.8% of households in Bronxville earn $75,000 to $99,999.
15.0% of households in Bronxville earn $100,000 to $149,999.
12.9% of households in Bronxville earn $150,000 to $199,999.
52.1% of households in Bronxville earn $200,000 or more.
| Income | Bronxville | NY | USA |
|---|---|---|---|
| Less than $10,000 | 0.8% | 5.8% | 5.0% |
| $10,000 to $14,999 | 0.0% | 3.9% | 3.4% |
| $15,000 to $24,999 | 6.1% | 6.3% | 6.3% |
| $25,000 to $34,999 | 0.6% | 6.2% | 6.6% |
| $35,000 to $49,999 | 2.2% | 8.9% | 10.1% |
| $50,000 to $74,999 | 4.6% | 13.6% | 15.5% |
| $75,000 to $99,999 | 5.8% | 11.4% | 12.6% |
| $100,000 to $149,999 | 15.0% | 16.7% | 17.5% |
| $150,000 to $199,999 | 12.9% | 10.1% | 9.6% |
| $200,000 or more | 52.1% | 17.1% | 13.4% |
Source: U.S. Census ACS 5-year estimates (2024)


