Pleasantville SnackAbility
Overall SnackAbility
Cost of living in Pleasantville summary. We use data on the cost of living to determine how expensive it is to live in Pleasantville. Real estate prices drive most of the variance in cost of living around New York. Key points include:
The cost of living in Pleasantville is 178 with 100 being average.
The cost of living in Pleasantville is 1.8x higher than the national average.
The median home value in Pleasantville is $987,581.
The median income in Pleasantville is $136,406.
Pleasantville's Overall Cost Of Living
Higher Than The National Average
Cost Of Living In Pleasantville Comparison Table
| Living Expense | Pleasantville | New York | National Average |
|---|---|---|---|
| Overall | 178 | 121 | 100 |
| Services | 105 | 105 | 100 |
| Groceries | 112 | 108 | 100 |
| Health | 333 | 143 | 100 |
| Housing | 117 | 112 | 100 |
| Transportation | 115 | 114 | 100 |
| Utilities | 114 | 111 | 100 |
Source: Cost of living index, normalized to US average = 100
Pleasantville, NY Weather
The average high in Pleasantville is 61.5° and the average low is 43.4°.
There are 80.5 days of precipitation each year.
Expect an average of 48.7 inches of precipitation each year with 32.9 inches of snow.
| Stat | Pleasantville |
|---|---|
| Average Annual High | 61.5 |
| Average Annual Low | 43.4 |
| Annual Precipitation Days | 80.5 |
| Average Annual Precipitation | 48.7 |
| Average Annual Snowfall | 32.9 |
Average High
Days of Rain
Source: NOAA climate normals (30-year)
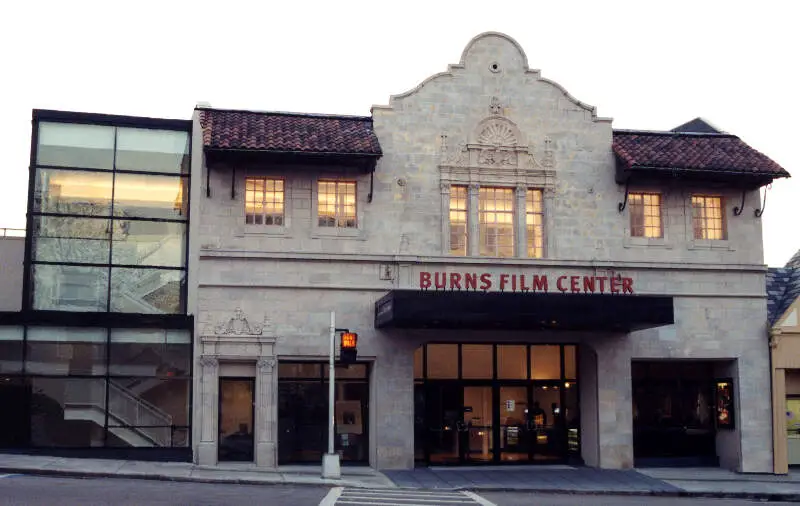
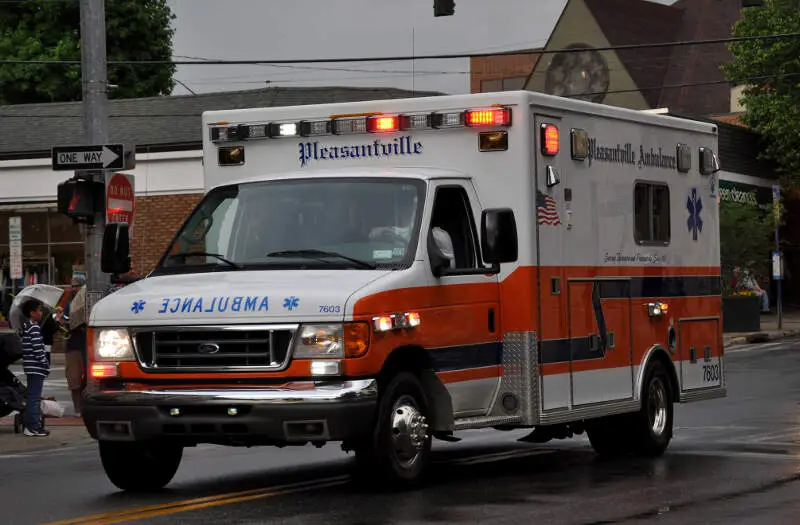
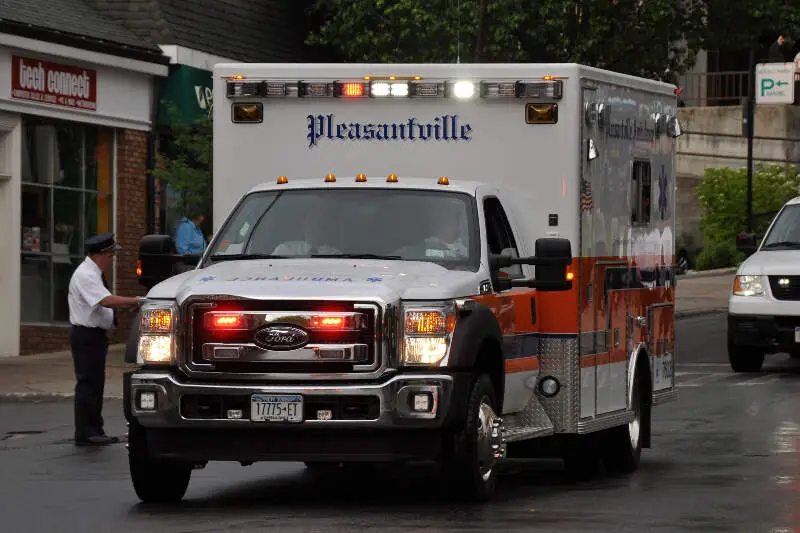
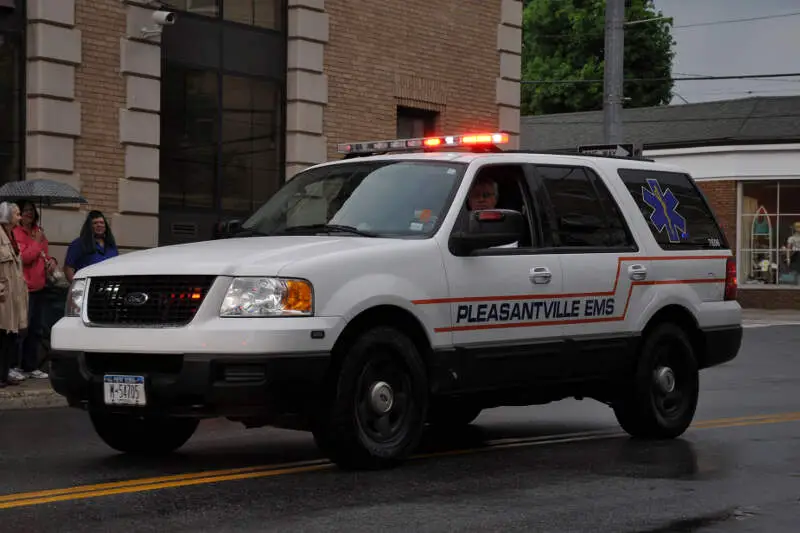
Pleasantville, NY Photos
Rankings & Articles For Pleasantville


Locations Around Pleasantville
Map Of Pleasantville, NY
Best Places Around Pleasantville
Bronxville, NY
Population 6,510
Pelham Manor, NY
Population 5,644
Larchmont, NY
Population 6,567
Briarcliff Manor, NY
Population 7,519
Tappan, NY
Population 6,687
Irvington, NY
Population 6,531
Mamaroneck, NY
Population 19,826
Blauvelt, NY
Population 5,406
Eastchester, NY
Population 20,491
Pleasantville Demographics And Statistics
Population over time in Pleasantville
The current population in Pleasantville is 7,371. The population has increased 5.1% from 2010.
| Year | Population | % Change |
|---|---|---|
| 2024 | 7,371 | -0.3% |
| 2023 | 7,395 | -0.5% |
| 2022 | 7,430 | -0.5% |
| 2021 | 7,469 | 2.9% |
| 2020 | 7,256 | 0.5% |
| 2019 | 7,221 | 0.1% |
| 2018 | 7,214 | -0.8% |
| 2017 | 7,275 | 2.0% |
| 2016 | 7,134 | 0.1% |
| 2015 | 7,125 | 0.5% |
| 2014 | 7,090 | 0.5% |
| 2013 | 7,055 | 0.4% |
| 2012 | 7,027 | 0.1% |
| 2011 | 7,017 | 0.0% |
| 2010 | 7,015 | - |
Race / Ethnicity in Pleasantville
See the full breakdown
Pleasantville is:
79.9% White with 5,890 White residents.
1.6% African American with 116 African American residents.
0.0% American Indian with 0 American Indian residents.
0.9% Asian with 70 Asian residents.
0.0% Hawaiian with 0 Hawaiian residents.
0.5% Other with 39 Other residents.
1.2% Two Or More with 85 Two Or More residents.
15.9% Hispanic with 1,171 Hispanic residents.
| Race | Pleasantville | NY | USA |
|---|---|---|---|
| White | 79.9% | 52.8% | 57.4% |
| African American | 1.6% | 13.4% | 11.9% |
| American Indian | 0.0% | 0.2% | 0.5% |
| Asian | 0.9% | 9.0% | 5.9% |
| Hawaiian | 0.0% | 0.0% | 0.2% |
| Other | 0.5% | 1.0% | 0.6% |
| Two Or More | 1.2% | 3.8% | 4.3% |
| Hispanic | 15.9% | 19.8% | 19.3% |
Gender in Pleasantville
See the full breakdown
Pleasantville is 51.8% female with 3,816 female residents.
Pleasantville is 48.2% male with 3,554 male residents.
| Gender | Pleasantville | NY | USA |
|---|---|---|---|
| Female | 51.8% | 51.2% | 50.5% |
| Male | 48.2% | 48.8% | 49.5% |
Highest level of educational attainment in Pleasantville for adults over 25
See the full breakdown
2.0% of adults in Pleasantville completed < 9th grade.
4.0% of adults in Pleasantville completed 9-12th grade.
11.0% of adults in Pleasantville completed high school / ged.
9.0% of adults in Pleasantville completed some college.
4.0% of adults in Pleasantville completed associate's degree.
35.0% of adults in Pleasantville completed bachelor's degree.
22.0% of adults in Pleasantville completed master's degree.
8.0% of adults in Pleasantville completed professional degree.
5.0% of adults in Pleasantville completed doctorate degree.
| Education | Pleasantville | NY | USA |
|---|---|---|---|
| < 9th Grade | 2.0% | 6.0% | 4.0% |
| 9-12th Grade | 4.0% | 6.0% | 6.0% |
| High School / GED | 11.0% | 24.0% | 26.0% |
| Some College | 9.0% | 15.0% | 19.0% |
| Associate's Degree | 4.0% | 9.0% | 9.0% |
| Bachelor's Degree | 35.0% | 22.0% | 22.0% |
| Master's Degree | 22.0% | 13.0% | 10.0% |
| Professional Degree | 8.0% | 3.0% | 2.0% |
| Doctorate Degree | 5.0% | 2.0% | 2.0% |
Household Income For Pleasantville, New York
See the full breakdown
0.8% of households in Pleasantville earn Less than $10,000.
3.4% of households in Pleasantville earn $10,000 to $14,999.
5.2% of households in Pleasantville earn $15,000 to $24,999.
4.9% of households in Pleasantville earn $25,000 to $34,999.
9.4% of households in Pleasantville earn $35,000 to $49,999.
9.2% of households in Pleasantville earn $50,000 to $74,999.
8.6% of households in Pleasantville earn $75,000 to $99,999.
9.9% of households in Pleasantville earn $100,000 to $149,999.
9.1% of households in Pleasantville earn $150,000 to $199,999.
39.5% of households in Pleasantville earn $200,000 or more.
| Income | Pleasantville | NY | USA |
|---|---|---|---|
| Less than $10,000 | 0.8% | 5.8% | 5.0% |
| $10,000 to $14,999 | 3.4% | 3.9% | 3.4% |
| $15,000 to $24,999 | 5.2% | 6.3% | 6.3% |
| $25,000 to $34,999 | 4.9% | 6.2% | 6.6% |
| $35,000 to $49,999 | 9.4% | 8.9% | 10.1% |
| $50,000 to $74,999 | 9.2% | 13.6% | 15.5% |
| $75,000 to $99,999 | 8.6% | 11.4% | 12.6% |
| $100,000 to $149,999 | 9.9% | 16.7% | 17.5% |
| $150,000 to $199,999 | 9.1% | 10.1% | 9.6% |
| $200,000 or more | 39.5% | 17.1% | 13.4% |
Source: U.S. Census ACS 5-year estimates (2024)


