Buffalo SnackAbility
Overall SnackAbility
Crime in Buffalo summary. We use data from the FBI to determine the crime rates in Buffalo. Key points include:
There were 12,361 total crimes in Buffalo in the last reporting year.
The overall crime rate per 100,000 people in Buffalo is 4,515.8 / 100k people.
The violent crime rate per 100,000 people in Buffalo is 706.2 / 100k people.
The property crime rate per 100,000 people in Buffalo is 3,809.6 / 100k people.
Overall, crime in Buffalo is 113.09% above the national average.
Total Crimes
Above National Average
Crime In Buffalo Comparison Table
| Statistic | Count Raw |
Buffalo / 100k People |
New York / 100k People |
National / 100k People |
|---|---|---|---|---|
| Total Crimes Per 100K | 12,361 | 4,515.8 | 2,099.7 | 2,119.2 |
| Violent Crime | 1,933 | 706.2 | 380.2 | 359.0 |
| Murder | 34 | 12.4 | 2.7 | 5.0 |
| Robbery | 432 | 157.8 | 96.1 | 61.0 |
| Aggravated Assault | 1,348 | 492.5 | 259.6 | 256.0 |
| Property Crime | 10,428 | 3,809.6 | 1,719.5 | 1,760.0 |
| Burglary | 1,199 | 438.0 | 136.6 | 229.0 |
| Larceny | 7,044 | 2,573.4 | 1,432.8 | 1,272.0 |
| Car Theft | 2,185 | 798.2 | 150.2 | 259.0 |
Source: FBI Uniform Crime Reporting (2024)
Cost of living in Buffalo summary. We use data on the cost of living to determine how expensive it is to live in Buffalo. Real estate prices drive most of the variance in cost of living around New York. Key points include:
The cost of living in Buffalo is 97 with 100 being average.
The cost of living in Buffalo is 1.0x lower than the national average.
The median home value in Buffalo is $238,088.
The median income in Buffalo is $50,041.
Buffalo's Overall Cost Of Living
Lower Than The National Average
Cost Of Living In Buffalo Comparison Table
| Living Expense | Buffalo | New York | National Average |
|---|---|---|---|
| Overall | 97 | 121 | 100 |
| Services | 110 | 105 | 100 |
| Groceries | 108 | 108 | 100 |
| Health | 65 | 143 | 100 |
| Housing | 118 | 112 | 100 |
| Transportation | 114 | 114 | 100 |
| Utilities | 114 | 111 | 100 |
Source: Cost of living index, normalized to US average = 100
Buffalo, NY Weather
The average high in Buffalo is 56.6° and the average low is 39.7°.
There are 92.7 days of precipitation each year.
Expect an average of 39.5 inches of precipitation each year with 88.6 inches of snow.
| Stat | Buffalo |
|---|---|
| Average Annual High | 56.6 |
| Average Annual Low | 39.7 |
| Annual Precipitation Days | 92.7 |
| Average Annual Precipitation | 39.5 |
| Average Annual Snowfall | 88.6 |
Average High
Days of Rain
Source: NOAA climate normals (30-year)
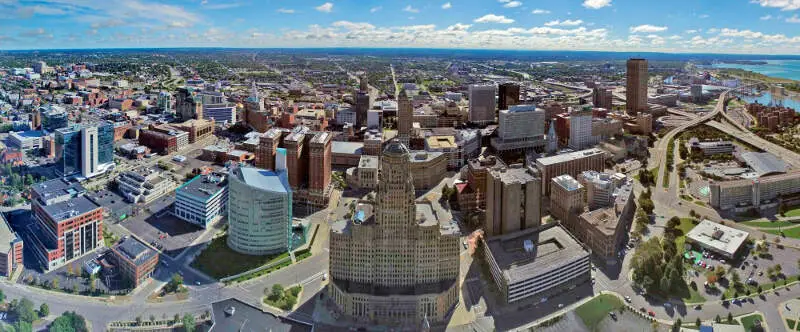
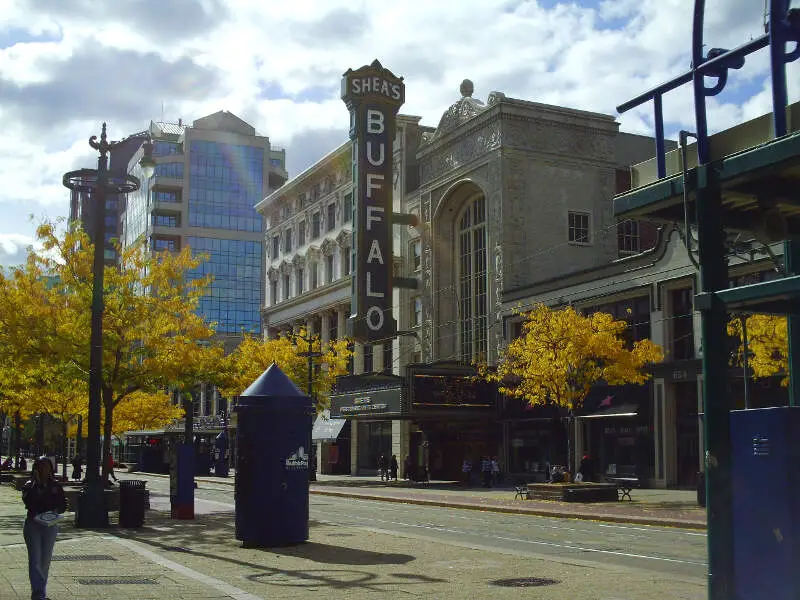
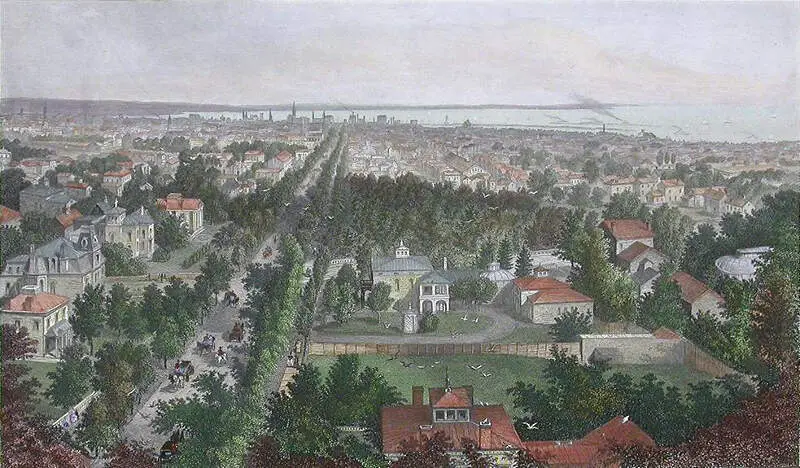
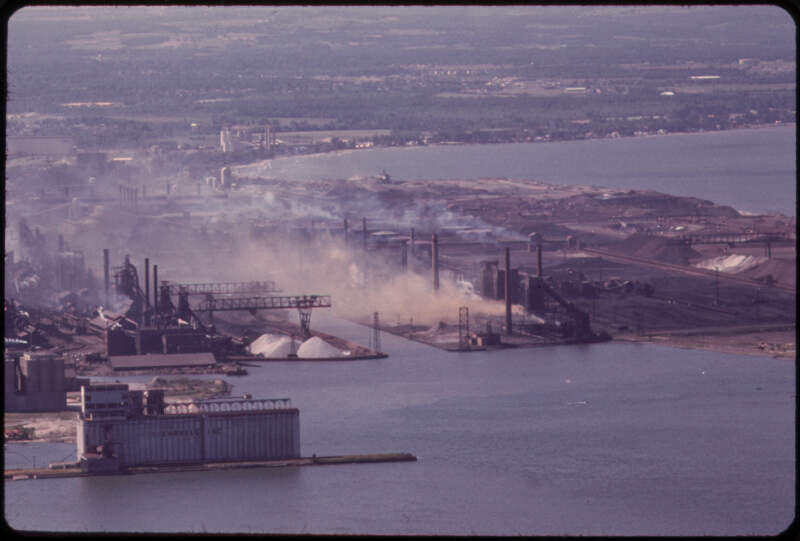
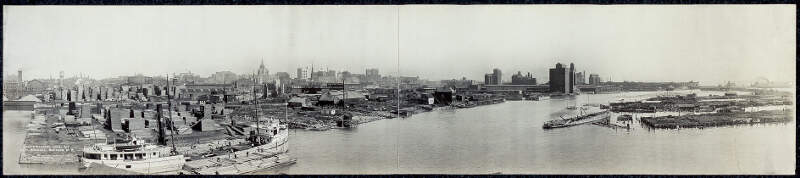
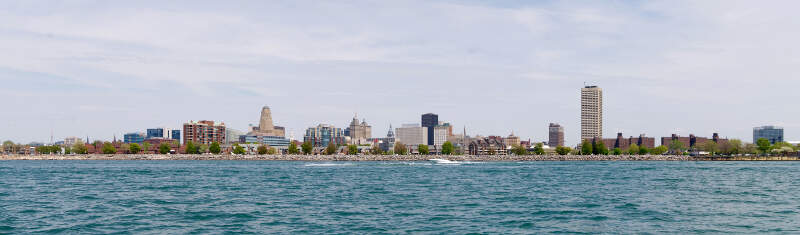
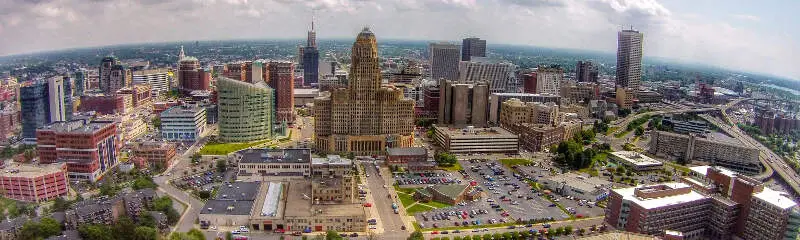
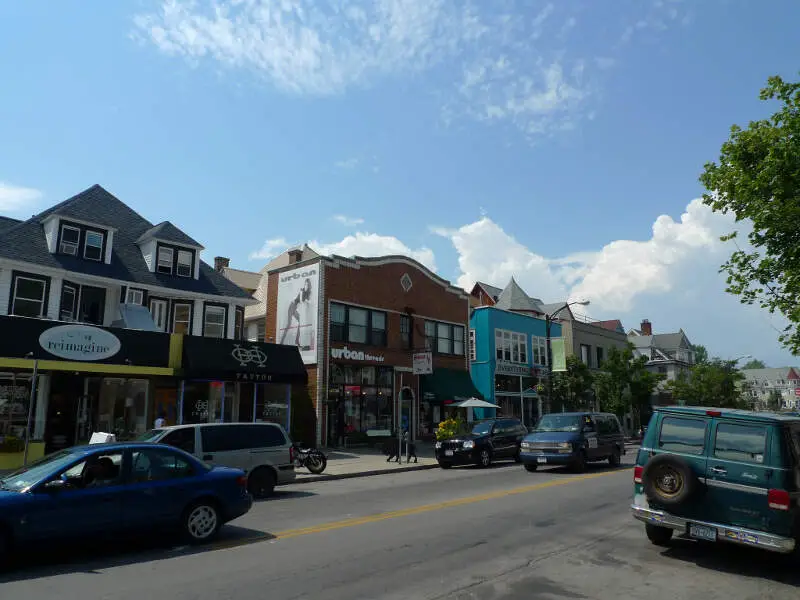
Buffalo, NY Photos
3 Reviews & Comments About Buffalo

I don't like buffalo NY at all it is very confusing city and very ugly with barely any jobs the transportation system is very bad.
It is a bad place to go to live and no place to raise a family
Great time bars are open till 4 and the architecture is amazing. Frank Lloyd Wright did a lot in the city. And it's home to the best dive bar in the state, the pink!
The pink, canal side, bills game tailgating, Allen street, elmwood village
Buffalo now has a beautiful waterfront. It is a great place to raise a family and homes are reasonably priced.
Pros: Waterfront, Albright Knox Art Gallery, Food, Affordability, NHL hockey, NFL football
Cons: We all know about the snow, but it is manageable.
Rankings & Articles For Buffalo


Locations Around Buffalo
Map Of Buffalo, NY
Best Places Around Buffalo
Hamburg, NY
Population 9,792
Harris Hill, NY
Population 6,069
East Aurora, NY
Population 5,993
Eggertsville, NY
Population 14,894
Williamsville, NY
Population 5,469
Kenmore, NY
Population 15,044
Lancaster, NY
Population 10,113
Buffalo Demographics And Statistics
Population over time in Buffalo
The current population in Buffalo is 276,854. The population has increased 4.1% from 2010.
| Year | Population | % Change |
|---|---|---|
| 2024 | 276,854 | 0.2% |
| 2023 | 276,397 | -0.1% |
| 2022 | 276,688 | 0.2% |
| 2021 | 276,011 | 7.9% |
| 2020 | 255,805 | -0.3% |
| 2019 | 256,480 | -0.4% |
| 2018 | 257,518 | -0.8% |
| 2017 | 259,574 | 0.2% |
| 2016 | 258,989 | -0.2% |
| 2015 | 259,517 | -0.2% |
| 2014 | 259,959 | -0.2% |
| 2013 | 260,568 | -0.5% |
| 2012 | 261,955 | -0.7% |
| 2011 | 263,914 | -0.8% |
| 2010 | 266,012 | - |
Race / Ethnicity in Buffalo
See the full breakdown
Buffalo is:
42.4% White with 117,470 White residents.
31.3% African American with 86,532 African American residents.
0.3% American Indian with 790 American Indian residents.
8.7% Asian with 24,192 Asian residents.
0.0% Hawaiian with 14 Hawaiian residents.
0.4% Other with 1,229 Other residents.
4.6% Two Or More with 12,640 Two Or More residents.
12.3% Hispanic with 33,987 Hispanic residents.
| Race | Buffalo | NY | USA |
|---|---|---|---|
| White | 42.4% | 52.8% | 57.4% |
| African American | 31.3% | 13.4% | 11.9% |
| American Indian | 0.3% | 0.2% | 0.5% |
| Asian | 8.7% | 9.0% | 5.9% |
| Hawaiian | 0.0% | 0.0% | 0.2% |
| Other | 0.4% | 1.0% | 0.6% |
| Two Or More | 4.6% | 3.8% | 4.3% |
| Hispanic | 12.3% | 19.8% | 19.3% |
Gender in Buffalo
See the full breakdown
Buffalo is 52.3% female with 144,768 female residents.
Buffalo is 47.7% male with 132,086 male residents.
| Gender | Buffalo | NY | USA |
|---|---|---|---|
| Female | 52.3% | 51.2% | 50.5% |
| Male | 47.7% | 48.8% | 49.5% |
Highest level of educational attainment in Buffalo for adults over 25
See the full breakdown
5.0% of adults in Buffalo completed < 9th grade.
8.0% of adults in Buffalo completed 9-12th grade.
27.0% of adults in Buffalo completed high school / ged.
19.0% of adults in Buffalo completed some college.
10.0% of adults in Buffalo completed associate's degree.
17.0% of adults in Buffalo completed bachelor's degree.
10.0% of adults in Buffalo completed master's degree.
2.0% of adults in Buffalo completed professional degree.
2.0% of adults in Buffalo completed doctorate degree.
| Education | Buffalo | NY | USA |
|---|---|---|---|
| < 9th Grade | 5.0% | 6.0% | 4.0% |
| 9-12th Grade | 8.0% | 6.0% | 6.0% |
| High School / GED | 27.0% | 24.0% | 26.0% |
| Some College | 19.0% | 15.0% | 19.0% |
| Associate's Degree | 10.0% | 9.0% | 9.0% |
| Bachelor's Degree | 17.0% | 22.0% | 22.0% |
| Master's Degree | 10.0% | 13.0% | 10.0% |
| Professional Degree | 2.0% | 3.0% | 2.0% |
| Doctorate Degree | 2.0% | 2.0% | 2.0% |
Household Income For Buffalo, New York
See the full breakdown
9.2% of households in Buffalo earn Less than $10,000.
8.2% of households in Buffalo earn $10,000 to $14,999.
10.0% of households in Buffalo earn $15,000 to $24,999.
9.6% of households in Buffalo earn $25,000 to $34,999.
13.0% of households in Buffalo earn $35,000 to $49,999.
17.2% of households in Buffalo earn $50,000 to $74,999.
11.1% of households in Buffalo earn $75,000 to $99,999.
11.7% of households in Buffalo earn $100,000 to $149,999.
4.7% of households in Buffalo earn $150,000 to $199,999.
5.3% of households in Buffalo earn $200,000 or more.
| Income | Buffalo | NY | USA |
|---|---|---|---|
| Less than $10,000 | 9.2% | 5.8% | 5.0% |
| $10,000 to $14,999 | 8.2% | 3.9% | 3.4% |
| $15,000 to $24,999 | 10.0% | 6.3% | 6.3% |
| $25,000 to $34,999 | 9.6% | 6.2% | 6.6% |
| $35,000 to $49,999 | 13.0% | 8.9% | 10.1% |
| $50,000 to $74,999 | 17.2% | 13.6% | 15.5% |
| $75,000 to $99,999 | 11.1% | 11.4% | 12.6% |
| $100,000 to $149,999 | 11.7% | 16.7% | 17.5% |
| $150,000 to $199,999 | 4.7% | 10.1% | 9.6% |
| $200,000 or more | 5.3% | 17.1% | 13.4% |
Source: U.S. Census ACS 5-year estimates (2024)


