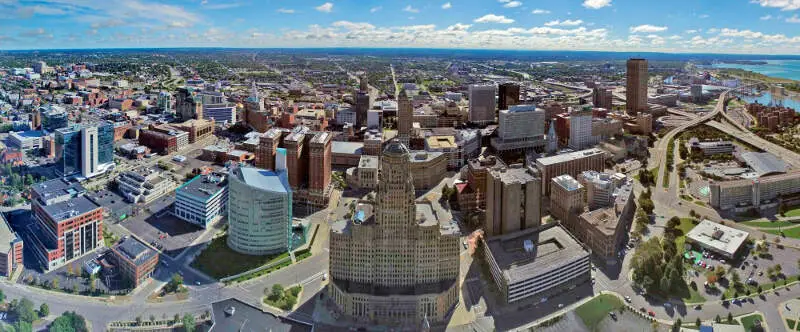
Buffalo’s neighborhoods conjure up too many stereotypes to count. You’ve got hipster areas, preppy places, neighborhoods where college kids thrive, and of course, ghettos.
It seems as if there’s a neighborhood for everyone in Buffalo.
And while the city consistently ranks as one of the best places to live in New York thanks in part to tons of entertainment and jobs, it’s not all rainbows and sunshine in Buffalo. Some neighborhoods aren’t as safe as others.
So the question arises, which Buffalo neighborhoods are the most dangerous and which are the safest?
Today, we’ll use Saturday Night Science to determine which Buffalo hoods need a little tender loving care – the sore thumbs of the Buffalo area if you will. Realistically, you can’t expect all the neighborhoods to be amazing, although South Abbott ranks way above the rest.
We examined 52 of Buffalo’s neighborhoods to find out the most dangerous places to live. These places don’t quite measure up to Buffalo’s reputation.
Table Of Contents: Top 10 | Methodology | Summary | Table
So what’s the worst neighborhood to live in Buffalo for 2025? According to the most recent census data, Emerson looks to be the worst neighborhood in Buffalo.
Read on to see how we determined the places around Buffalo that need a pick-me-up. And remember, don’t blame the messenger.
For more New York reading, check out:
- Best Places To Live In New York
- Cheapest Places To Live In New York
- Most Dangerous Places In New York
The 10 Most Dangerous Neighborhoods In Buffalo For 2025
/10
Population: 2,108
Violent Crimes Per 100k: 2,359
Property Crime Per 100k: 7,008
Median Home Value: $50,600 (6th worst)
Median Income: $23,804 (worst)
More on Emerson: Data
/10
Population: 3,029
Violent Crimes Per 100k: 1,006
Property Crime Per 100k: 5,307
Median Home Value: $47,550 (5th worst)
Median Income: $24,532 (4th worst)
More on Babcock: Data
/10
Population: 8,749
Violent Crimes Per 100k: 1,406
Property Crime Per 100k: 5,165
Median Home Value: $39,727 (2nd worst)
Median Income: $23,868 (2nd worst)
More on Broadway-Fillmore: Data
/10
Population: 2,102
Violent Crimes Per 100k: 1,603
Property Crime Per 100k: 7,906
Median Home Value: $31,100 (worst)
Median Income: $32,992 (16th worst)
More on Medical Park: Data
/10
Population: 3,764
Violent Crimes Per 100k: 1,747
Property Crime Per 100k: 5,425
Median Home Value: $40,050 (3rd worst)
Median Income: $27,957 (8th worst)
More on Genesee Moselle: Data
/10
Population: 462
Violent Crimes Per 100k: 968
Property Crime Per 100k: 5,369
Median Home Value: $75,600 (2worst)
Median Income: $28,346 (9th worst)
More on Squaw Island: Data
/10
Population: 2,942
Violent Crimes Per 100k: 1,945
Property Crime Per 100k: 5,833
Median Home Value: $61,480 (14th worst)
Median Income: $29,420 (13th worst)
More on Mlk Park: Data
/10
Population: 685
Violent Crimes Per 100k: 468
Property Crime Per 100k: 3,488
Median Home Value: $44,050 (4th worst)
Median Income: $27,932 (7th worst)
More on Valley: Data
/10
Population: 2,465
Violent Crimes Per 100k: 1,800
Property Crime Per 100k: 5,728
Median Home Value: $65,150 (15th worst)
Median Income: $24,229 (3rd worst)
More on Masten Park: Data
/10
Population: 10,298
Violent Crimes Per 100k: 1,573
Property Crime Per 100k: 6,212
Median Home Value: $51,136 (8th worst)
Median Income: $28,852 (12th worst)
More on Schiller Park: Data
Methodology: How we determined the most dangerous Buffalo neighborhoods in 2025
To figure out how bad a place is to live in, we only needed to know what kinds of things people like and then decide what places have the least amount of those things. We plugged the following criteria into Saturday Night Science to get the worst neighborhoods in Buffalo:
- High crime (Estimated)
- High unemployment (Less jobs)
- Low median income (Less pay)
- Low population density (No things to do)
- Low home values (No one’s willing to pay to live here)
Then, we ranked each neighborhood in Buffalo, New York for each of these criteria from worst to best.
Next, we averaged the individual rankings for each criterion into a “Worst Score.”
The neighborhood with the lowest “Worst Score” ranks as the most dangerous neighborhood of Buffalo.
The article is an opinion based on facts and is meant as infotainment. We updated this article for 2025. This report is our time ranking the worst neighborhoods to live in Buffalo.
Skip to the end to see the list of all 52 neighborhoods ranked from worst to best.
Summary: The Worst Neighborhoods Around Buffalo
Well, there you have it — the worst of the neighborhoods in Buffalo with Emerson landing at the bottom of the pack.
The worst neighborhoods in Buffalo are Emerson, Babcock, Broadway-Fillmore, Medical Park, Genesee Moselle, Squaw Island, Mlk Park, Valley, Masten Park, and Schiller Park.
As mentioned earlier, the neighborhoods in Buffalo aren’t all bad. South Abbott takes the cake as the best place to live in Buffalo.
The best neighborhoods in Buffalo are South Abbott, North Park, Starin Central, Albright, and Central Business District.
We ranked the neighborhoods from worst to best in the chart below.
For more New York reading, check out:
- Richest Cities In New York
- Safest Places In New York According To Science
- Worst Places To Live In New York State
Most Dangerous Neighborhoods To Live In Buffalo For 2025?
| Rank | Neighborhood | Population | Home Value | Median Income |
|---|---|---|---|---|
| 1 | Emerson | 2,108 | $50,600 | $23,804 |
| 2 | Babcock | 3,029 | $47,550 | $24,532 |
| 3 | Broadway-Fillmore | 8,749 | $39,727 | $23,868 |
| 4 | Medical Park | 2,102 | $31,100 | $32,992 |
| 5 | Genesee Moselle | 3,764 | $40,050 | $27,957 |
| 6 | Squaw Island | 462 | $75,600 | $28,346 |
| 7 | Mlk Park | 2,942 | $61,480 | $29,420 |
| 8 | Valley | 685 | $44,050 | $27,932 |
| 9 | Masten Park | 2,465 | $65,150 | $24,229 |
| 10 | Schiller Park | 10,298 | $51,136 | $28,852 |
| 11 | Grider | 5,495 | $58,000 | $34,202 |
| 12 | Lovejoy | 6,127 | $57,822 | $32,108 |
| 13 | South Ellicott | 2,376 | $73,900 | $33,740 |
| 14 | Kingsley | 2,652 | $55,525 | $33,976 |
| 15 | First Ward | 1,201 | $51,100 | $28,750 |
| 16 | Military | 4,024 | $98,467 | $37,590 |
| 17 | Willert Park | 4,582 | $167,825 | $25,014 |
| 18 | Tifft | 1,045 | $57,600 | $38,752 |
| 19 | Emslie | 1,521 | $74,175 | $32,854 |
| 20 | Kenfield | 7,136 | $58,729 | $36,236 |
| 21 | Leroy | 5,169 | $110,557 | $36,770 |
| 22 | Lasalle | 9,088 | $91,614 | $42,032 |
| 23 | Black Rock | 6,883 | $127,562 | $40,531 |
| 24 | Cold Spring | 1,237 | $80,750 | $50,303 |
| 25 | Delaware Park | 1,741 | $227,840 | $63,047 |
| 26 | Waterfront | 951 | $492,400 | $35,846 |
| 27 | Kaisertown | 5,454 | $73,667 | $44,263 |
| 28 | Triangle | 3,806 | $85,160 | $50,160 |
| 29 | Allen | 3,045 | $257,525 | $41,923 |
| 30 | Riverside Park | 11,251 | $71,100 | $28,679 |
| 31 | Seneca | 2,907 | $84,680 | $39,029 |
| 32 | Lakeview | 4,139 | $195,367 | $26,270 |
| 33 | Park Meadow | 3,361 | $268,100 | $72,990 |
| 34 | Kensington | 11,649 | $74,338 | $44,136 |
| 35 | Columbus | 2,350 | $271,300 | $34,538 |
| 36 | Grant Ferry | 7,396 | $167,853 | $58,566 |
| 37 | Cazenovia Park | 5,098 | $93,060 | $40,789 |
| 38 | North Delaware | 2,232 | $158,943 | $44,597 |
| 39 | South Park | 5,836 | $116,900 | $61,144 |
| 40 | Bryant | 6,083 | $328,200 | $41,622 |
| 41 | University | 5,334 | $120,567 | $56,623 |
| 42 | Forest | 9,331 | $231,118 | $61,585 |
| 43 | Abbott Mckinley | 7,076 | $118,271 | $68,309 |
| 44 | Front Park | 12,235 | $197,789 | $41,665 |
| 45 | Hamlin Park | 6,045 | $103,980 | $46,968 |
| 46 | Delaware-West Ferry | 6,397 | $325,714 | $60,893 |
| 47 | Parkside | 2,865 | $250,233 | $76,898 |
| 48 | Central Business District | 1,657 | $394,850 | $68,676 |
| 49 | Albright | 2,729 | $412,040 | $68,808 |
| 50 | Starin Central | 5,145 | $232,700 | $74,251 |
| 51 | North Park | 12,100 | $225,476 | $71,004 |
| 52 | South Abbott | 3,476 | $122,600 | $80,316 |