Elmira SnackAbility
Overall SnackAbility
Crime in Elmira summary. We use data from the FBI to determine the crime rates in Elmira. Key points include:
There were 1,224 total crimes in Elmira in the last reporting year.
The overall crime rate per 100,000 people in Elmira is 4,684.3 / 100k people.
The violent crime rate per 100,000 people in Elmira is 547.3 / 100k people.
The property crime rate per 100,000 people in Elmira is 4,137.0 / 100k people.
Overall, crime in Elmira is 121.04% above the national average.
Total Crimes
Above National Average
Crime In Elmira Comparison Table
| Statistic | Count Raw |
Elmira / 100k People |
New York / 100k People |
National / 100k People |
|---|---|---|---|---|
| Total Crimes Per 100K | 1,224 | 4,684.3 | 2,099.7 | 2,119.2 |
| Violent Crime | 143 | 547.3 | 380.2 | 359.0 |
| Murder | 1 | 3.8 | 2.7 | 5.0 |
| Robbery | 22 | 84.2 | 96.1 | 61.0 |
| Aggravated Assault | 115 | 440.1 | 259.6 | 256.0 |
| Property Crime | 1,081 | 4,137.0 | 1,719.5 | 1,760.0 |
| Burglary | 112 | 428.6 | 136.6 | 229.0 |
| Larceny | 949 | 3,631.8 | 1,432.8 | 1,272.0 |
| Car Theft | 20 | 76.5 | 150.2 | 259.0 |
Source: FBI Uniform Crime Reporting (2024)
Cost of living in Elmira summary. We use data on the cost of living to determine how expensive it is to live in Elmira. Real estate prices drive most of the variance in cost of living around New York. Key points include:
The cost of living in Elmira is 91 with 100 being average.
The cost of living in Elmira is 0.9x lower than the national average.
The median home value in Elmira is $122,491.
The median income in Elmira is $43,120.
Elmira's Overall Cost Of Living
Lower Than The National Average
Cost Of Living In Elmira Comparison Table
| Living Expense | Elmira | New York | National Average |
|---|---|---|---|
| Overall | 91 | 121 | 100 |
| Services | 106 | 105 | 100 |
| Groceries | 108 | 108 | 100 |
| Health | 50 | 143 | 100 |
| Housing | 110 | 112 | 100 |
| Transportation | 112 | 114 | 100 |
| Utilities | 106 | 111 | 100 |
Source: Cost of living index, normalized to US average = 100
Elmira, NY Weather
The average high in Elmira is 58.5° and the average low is 36.2°.
There are 78.8 days of precipitation each year.
Expect an average of 35.4 inches of precipitation each year with 38.9 inches of snow.
| Stat | Elmira |
|---|---|
| Average Annual High | 58.5 |
| Average Annual Low | 36.2 |
| Annual Precipitation Days | 78.8 |
| Average Annual Precipitation | 35.4 |
| Average Annual Snowfall | 38.9 |
Average High
Days of Rain
Source: NOAA climate normals (30-year)
Elmira, NY Photos
1 Reviews & Comments About Elmira

Elmira was a nice small city with lots of areas around it Pine City, Elmira Heights, Horseheads, Big Flats, Corning so it is quite a large area of people and places. The city has tried to come back after the flood which took a lot of the buildings. It is not bad here at all I am mad they put it on the list..
Rankings & Articles For Elmira


Locations Around Elmira
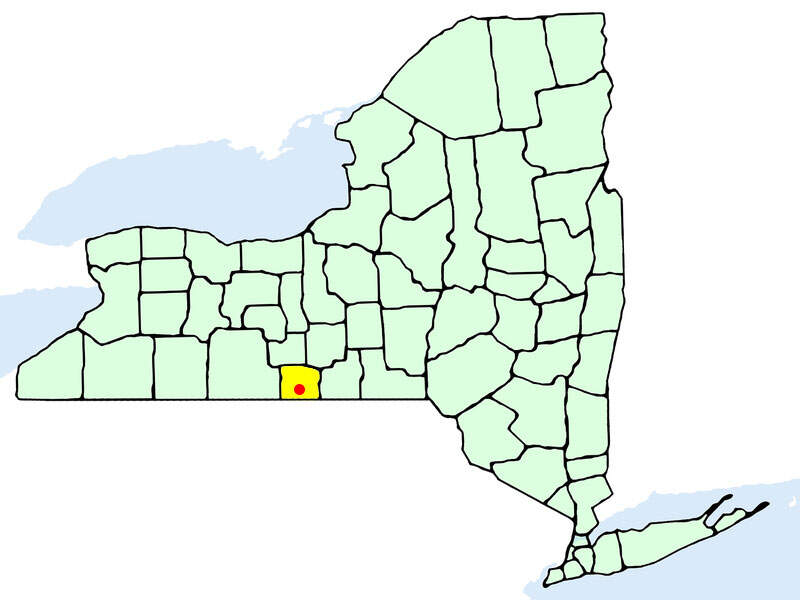
Map Of Elmira, NY
Best Places Around Elmira
Big Flats, NY
Population 5,651
Sayre, PA
Population 5,431
Corning, NY
Population 10,643
Horseheads, NY
Population 6,449
Southport, NY
Population 6,450
Elmira Demographics And Statistics
Population over time in Elmira
The current population in Elmira is 26,257. The population has decreased 10.6% from 2010.
| Year | Population | % Change |
|---|---|---|
| 2024 | 26,257 | -0.3% |
| 2023 | 26,349 | -0.5% |
| 2022 | 26,494 | -0.9% |
| 2021 | 26,737 | -1.8% |
| 2020 | 27,236 | -0.6% |
| 2019 | 27,402 | -1.1% |
| 2018 | 27,695 | -2.1% |
| 2017 | 28,302 | -1.0% |
| 2016 | 28,583 | -0.8% |
| 2015 | 28,817 | -0.8% |
| 2014 | 29,046 | -0.4% |
| 2013 | 29,176 | 0.0% |
| 2012 | 29,173 | -0.4% |
| 2011 | 29,304 | -0.2% |
| 2010 | 29,354 | - |
Race / Ethnicity in Elmira
See the full breakdown
Elmira is:
69.4% White with 18,223 White residents.
14.8% African American with 3,879 African American residents.
0.3% American Indian with 74 American Indian residents.
1.3% Asian with 354 Asian residents.
0.0% Hawaiian with 0 Hawaiian residents.
0.8% Other with 209 Other residents.
6.0% Two Or More with 1,565 Two Or More residents.
7.4% Hispanic with 1,953 Hispanic residents.
| Race | Elmira | NY | USA |
|---|---|---|---|
| White | 69.4% | 52.8% | 57.4% |
| African American | 14.8% | 13.4% | 11.9% |
| American Indian | 0.3% | 0.2% | 0.5% |
| Asian | 1.3% | 9.0% | 5.9% |
| Hawaiian | 0.0% | 0.0% | 0.2% |
| Other | 0.8% | 1.0% | 0.6% |
| Two Or More | 6.0% | 3.8% | 4.3% |
| Hispanic | 7.4% | 19.8% | 19.3% |
Gender in Elmira
See the full breakdown
Elmira is 51.4% female with 13,485 female residents.
Elmira is 48.6% male with 12,771 male residents.
| Gender | Elmira | NY | USA |
|---|---|---|---|
| Female | 51.4% | 51.2% | 50.5% |
| Male | 48.6% | 48.8% | 49.5% |
Highest level of educational attainment in Elmira for adults over 25
See the full breakdown
4.0% of adults in Elmira completed < 9th grade.
14.0% of adults in Elmira completed 9-12th grade.
37.0% of adults in Elmira completed high school / ged.
16.0% of adults in Elmira completed some college.
11.0% of adults in Elmira completed associate's degree.
10.0% of adults in Elmira completed bachelor's degree.
7.0% of adults in Elmira completed master's degree.
0.0% of adults in Elmira completed professional degree.
1.0% of adults in Elmira completed doctorate degree.
| Education | Elmira | NY | USA |
|---|---|---|---|
| < 9th Grade | 4.0% | 6.0% | 4.0% |
| 9-12th Grade | 14.0% | 6.0% | 6.0% |
| High School / GED | 37.0% | 24.0% | 26.0% |
| Some College | 16.0% | 15.0% | 19.0% |
| Associate's Degree | 11.0% | 9.0% | 9.0% |
| Bachelor's Degree | 10.0% | 22.0% | 22.0% |
| Master's Degree | 7.0% | 13.0% | 10.0% |
| Professional Degree | 0.0% | 3.0% | 2.0% |
| Doctorate Degree | 1.0% | 2.0% | 2.0% |
Household Income For Elmira, New York
See the full breakdown
9.6% of households in Elmira earn Less than $10,000.
8.5% of households in Elmira earn $10,000 to $14,999.
13.0% of households in Elmira earn $15,000 to $24,999.
9.8% of households in Elmira earn $25,000 to $34,999.
14.6% of households in Elmira earn $35,000 to $49,999.
16.5% of households in Elmira earn $50,000 to $74,999.
11.8% of households in Elmira earn $75,000 to $99,999.
12.4% of households in Elmira earn $100,000 to $149,999.
2.4% of households in Elmira earn $150,000 to $199,999.
1.4% of households in Elmira earn $200,000 or more.
| Income | Elmira | NY | USA |
|---|---|---|---|
| Less than $10,000 | 9.6% | 5.8% | 5.0% |
| $10,000 to $14,999 | 8.5% | 3.9% | 3.4% |
| $15,000 to $24,999 | 13.0% | 6.3% | 6.3% |
| $25,000 to $34,999 | 9.8% | 6.2% | 6.6% |
| $35,000 to $49,999 | 14.6% | 8.9% | 10.1% |
| $50,000 to $74,999 | 16.5% | 13.6% | 15.5% |
| $75,000 to $99,999 | 11.8% | 11.4% | 12.6% |
| $100,000 to $149,999 | 12.4% | 16.7% | 17.5% |
| $150,000 to $199,999 | 2.4% | 10.1% | 9.6% |
| $200,000 or more | 1.4% | 17.1% | 13.4% |
Source: U.S. Census ACS 5-year estimates (2024)


