Sayre SnackAbility
Overall SnackAbility
Cost of living in Sayre summary. We use data on the cost of living to determine how expensive it is to live in Sayre. Real estate prices drive most of the variance in cost of living around Pennsylvania. Key points include:
The cost of living in Sayre is 99 with 100 being average.
The cost of living in Sayre is 1.0x lower than the national average.
The median home value in Sayre is $193,070.
The median income in Sayre is $50,801.
Sayre's Overall Cost Of Living
Lower Than The National Average
Cost Of Living In Sayre Comparison Table
| Living Expense | Sayre | Pennsylvania | National Average |
|---|---|---|---|
| Overall | 99 | 97 | 100 |
| Services | 102 | 99 | 100 |
| Groceries | 107 | 100 | 100 |
| Health | 74 | 88 | 100 |
| Housing | 111 | 102 | 100 |
| Transportation | 113 | 100 | 100 |
| Utilities | 108 | 101 | 100 |
Source: Cost of living index, normalized to US average = 100
Sayre, PA Weather
The average high in Sayre is 59.1° and the average low is 36.4°.
There are 93.4 days of precipitation each year.
Expect an average of 35.5 inches of precipitation each year with 37.0 inches of snow.
| Stat | Sayre |
|---|---|
| Average Annual High | 59.1 |
| Average Annual Low | 36.4 |
| Annual Precipitation Days | 93.4 |
| Average Annual Precipitation | 35.5 |
| Average Annual Snowfall | 37.0 |
Average High
Days of Rain
Source: NOAA climate normals (30-year)
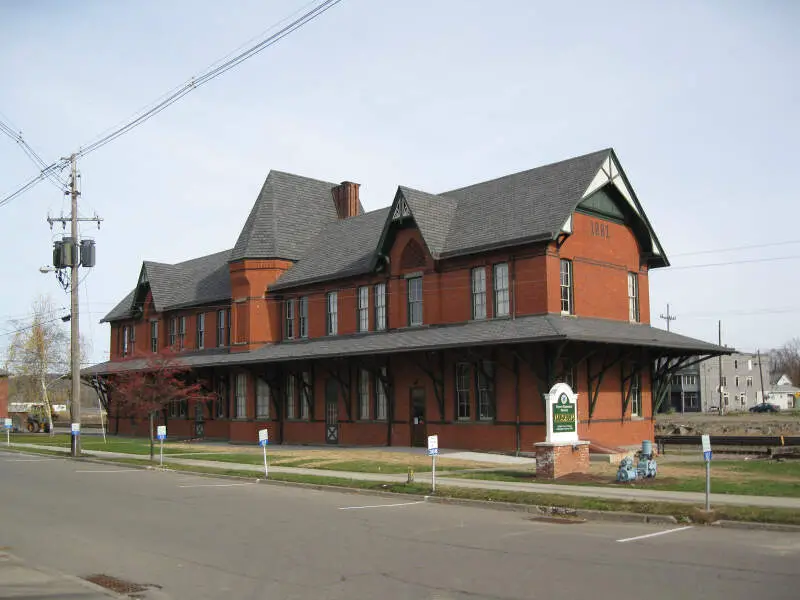
Sayre, PA Photos
Rankings & Articles For Sayre


Locations Around Sayre
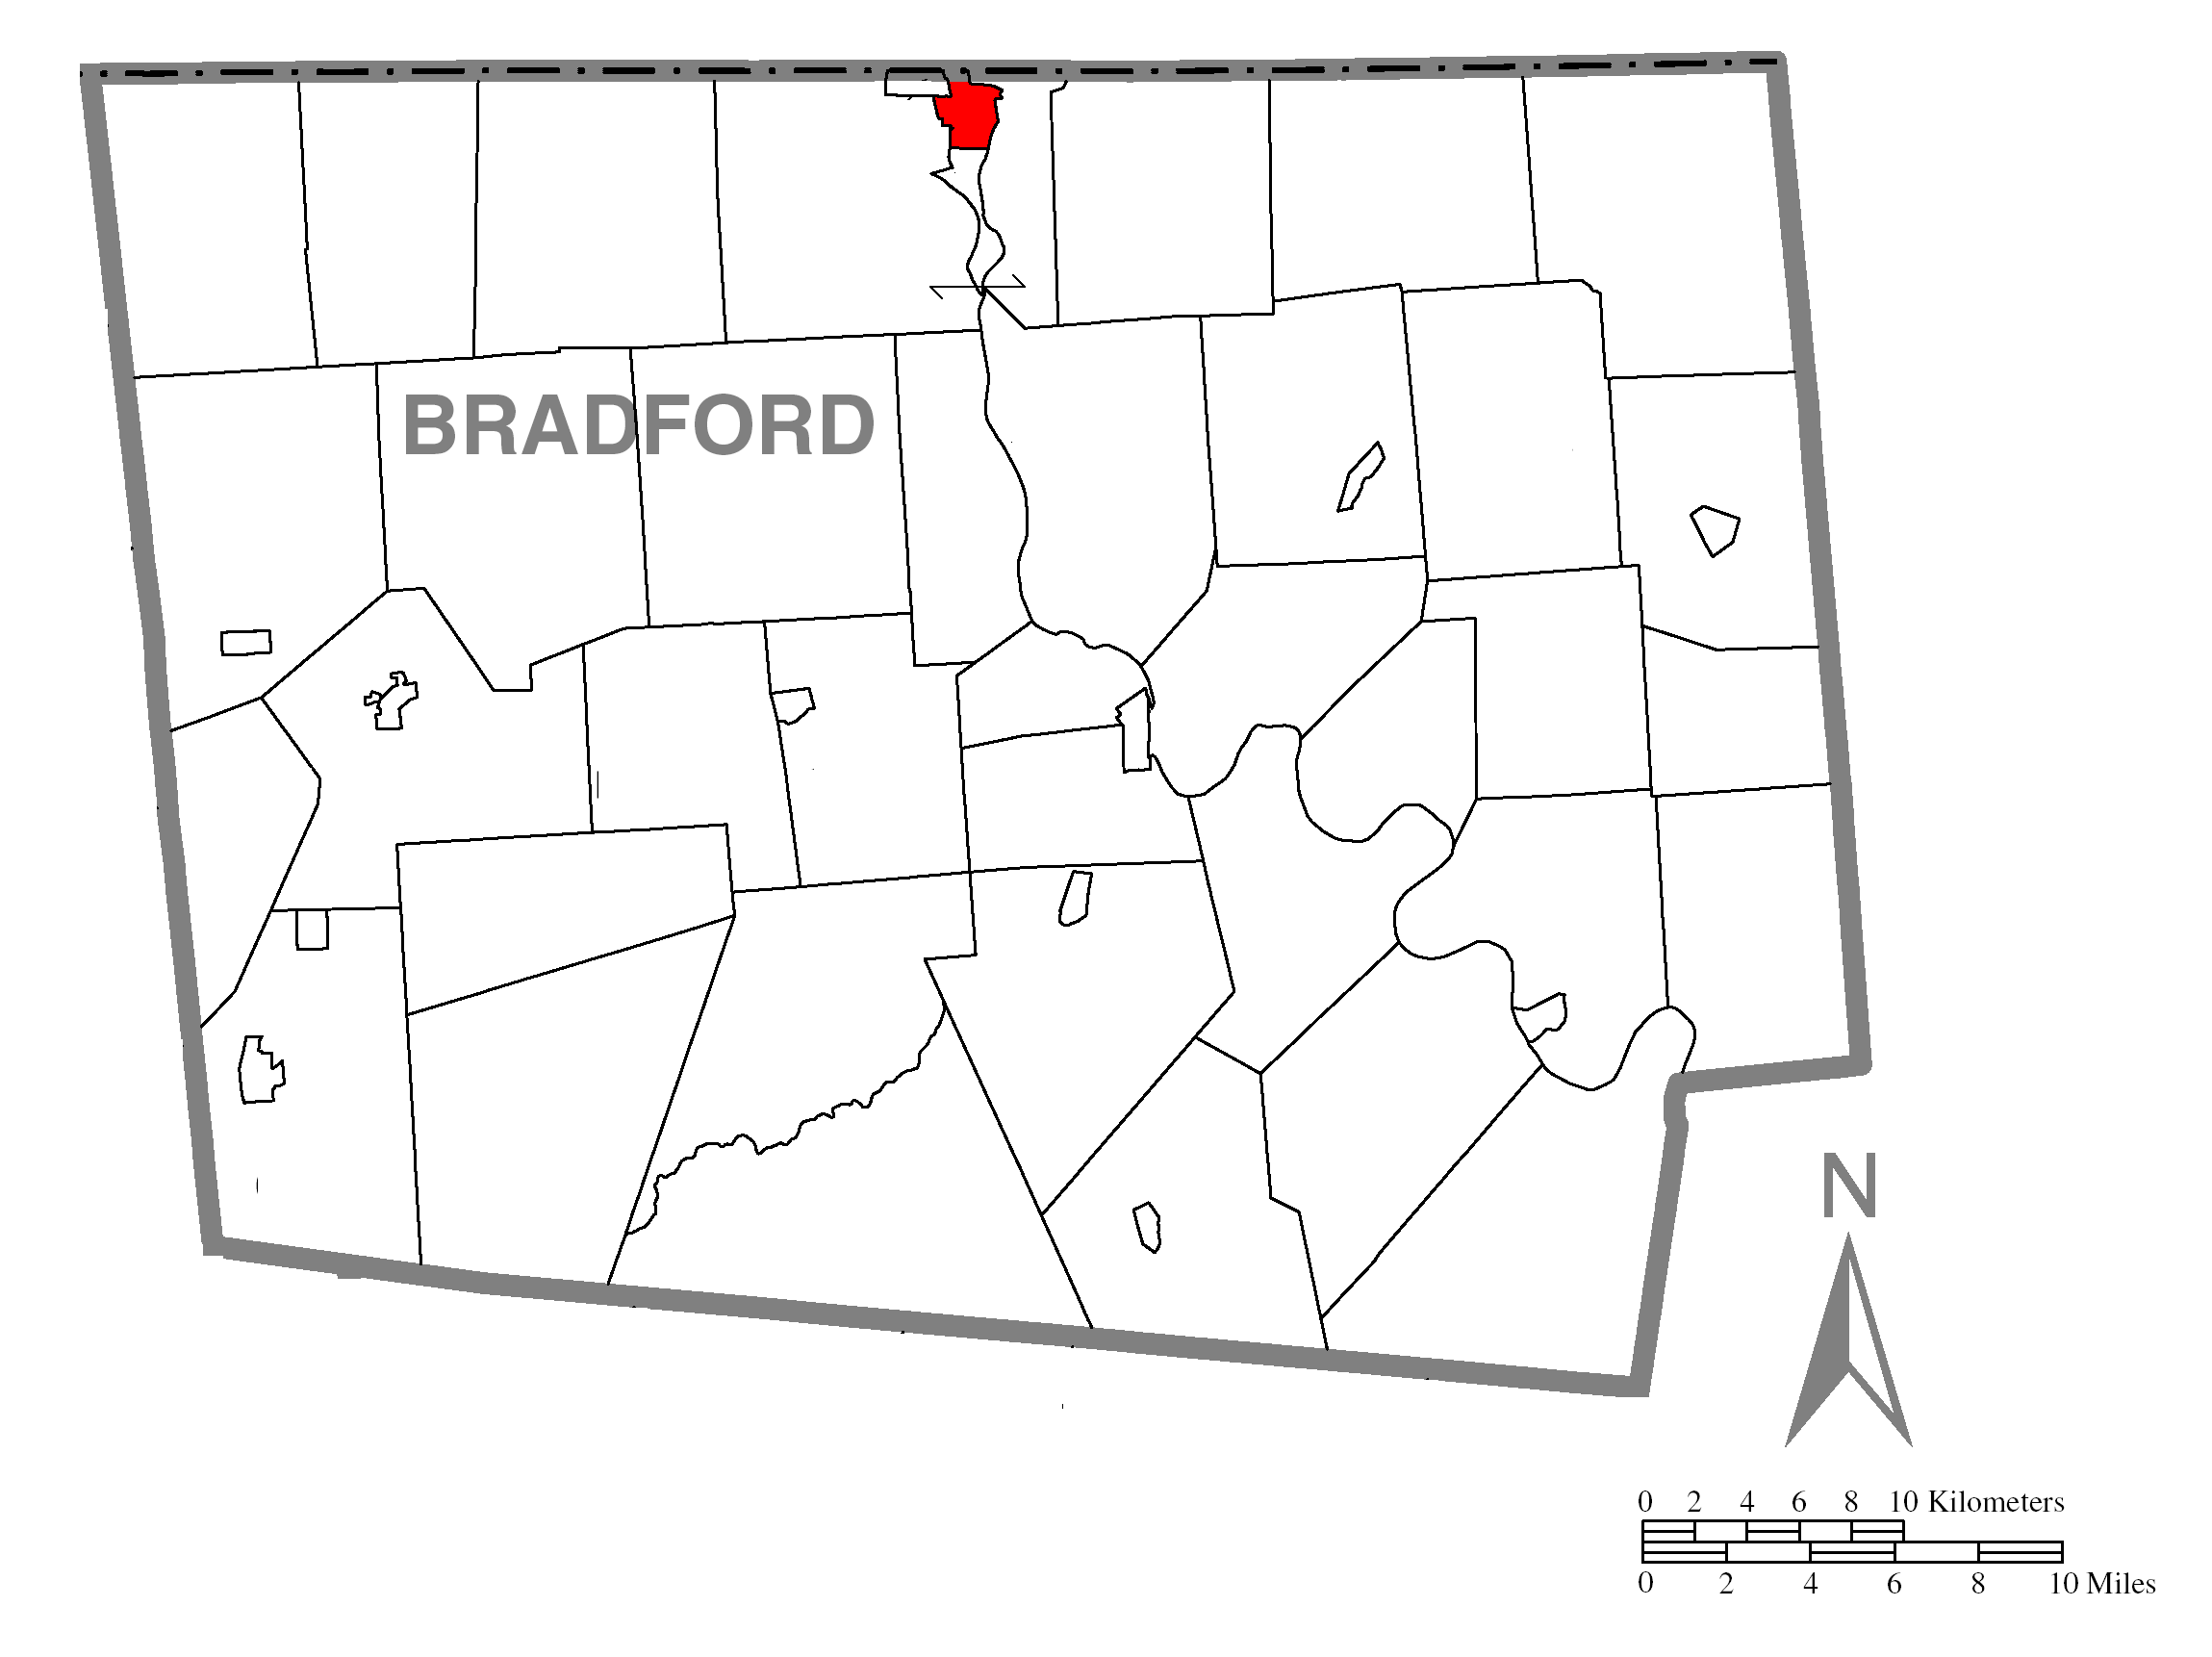
Map Of Sayre, PA
Best Places Around Sayre
South Hill, NY
Population 6,951
Ithaca, NY
Population 32,814
Endwell, NY
Population 11,546
Big Flats, NY
Population 5,651
Corning, NY
Population 10,643
Cortland, NY
Population 17,450
Endicott, NY
Population 13,387
Binghamton, NY
Population 47,151
Horseheads, NY
Population 6,449
Southport, NY
Population 6,450
Sayre Demographics And Statistics
Population over time in Sayre
The current population in Sayre is 5,431. The population has decreased 3.3% from 2010.
| Year | Population | % Change |
|---|---|---|
| 2024 | 5,431 | -0.2% |
| 2023 | 5,444 | -0.3% |
| 2022 | 5,463 | -0.4% |
| 2021 | 5,484 | 1.5% |
| 2020 | 5,403 | -0.9% |
| 2019 | 5,450 | -0.7% |
| 2018 | 5,491 | -0.6% |
| 2017 | 5,525 | 1.1% |
| 2016 | 5,467 | -0.8% |
| 2015 | 5,513 | -0.7% |
| 2014 | 5,553 | -0.4% |
| 2013 | 5,576 | 0.0% |
| 2012 | 5,574 | -0.5% |
| 2011 | 5,602 | -0.2% |
| 2010 | 5,616 | - |
Race / Ethnicity in Sayre
See the full breakdown
Sayre is:
88.2% White with 4,790 White residents.
2.0% African American with 110 African American residents.
0.0% American Indian with 0 American Indian residents.
0.6% Asian with 34 Asian residents.
0.0% Hawaiian with 0 Hawaiian residents.
0.8% Other with 44 Other residents.
6.0% Two Or More with 325 Two Or More residents.
2.4% Hispanic with 128 Hispanic residents.
| Race | Sayre | PA | USA |
|---|---|---|---|
| White | 88.2% | 73.0% | 57.4% |
| African American | 2.0% | 10.3% | 11.9% |
| American Indian | 0.0% | 0.1% | 0.5% |
| Asian | 0.6% | 3.8% | 5.9% |
| Hawaiian | 0.0% | 0.0% | 0.2% |
| Other | 0.8% | 0.5% | 0.6% |
| Two Or More | 6.0% | 3.6% | 4.3% |
| Hispanic | 2.4% | 8.7% | 19.3% |
Gender in Sayre
See the full breakdown
Sayre is 53.6% female with 2,911 female residents.
Sayre is 46.4% male with 2,519 male residents.
| Gender | Sayre | PA | USA |
|---|---|---|---|
| Female | 53.6% | 50.7% | 50.5% |
| Male | 46.4% | 49.3% | 49.5% |
Highest level of educational attainment in Sayre for adults over 25
See the full breakdown
3.0% of adults in Sayre completed < 9th grade.
3.0% of adults in Sayre completed 9-12th grade.
31.0% of adults in Sayre completed high school / ged.
13.0% of adults in Sayre completed some college.
14.0% of adults in Sayre completed associate's degree.
19.0% of adults in Sayre completed bachelor's degree.
14.0% of adults in Sayre completed master's degree.
3.0% of adults in Sayre completed professional degree.
0.0% of adults in Sayre completed doctorate degree.
| Education | Sayre | PA | USA |
|---|---|---|---|
| < 9th Grade | 3.0% | 3.0% | 4.0% |
| 9-12th Grade | 3.0% | 5.0% | 6.0% |
| High School / GED | 31.0% | 33.0% | 26.0% |
| Some College | 13.0% | 15.0% | 19.0% |
| Associate's Degree | 14.0% | 9.0% | 9.0% |
| Bachelor's Degree | 19.0% | 21.0% | 22.0% |
| Master's Degree | 14.0% | 10.0% | 10.0% |
| Professional Degree | 3.0% | 2.0% | 2.0% |
| Doctorate Degree | 0.0% | 2.0% | 2.0% |
Household Income For Sayre, Pennsylvania
See the full breakdown
4.4% of households in Sayre earn Less than $10,000.
5.0% of households in Sayre earn $10,000 to $14,999.
8.8% of households in Sayre earn $15,000 to $24,999.
10.4% of households in Sayre earn $25,000 to $34,999.
20.4% of households in Sayre earn $35,000 to $49,999.
12.9% of households in Sayre earn $50,000 to $74,999.
9.4% of households in Sayre earn $75,000 to $99,999.
10.9% of households in Sayre earn $100,000 to $149,999.
14.6% of households in Sayre earn $150,000 to $199,999.
3.2% of households in Sayre earn $200,000 or more.
| Income | Sayre | PA | USA |
|---|---|---|---|
| Less than $10,000 | 4.4% | 4.9% | 5.0% |
| $10,000 to $14,999 | 5.0% | 3.5% | 3.4% |
| $15,000 to $24,999 | 8.8% | 6.7% | 6.3% |
| $25,000 to $34,999 | 10.4% | 6.9% | 6.6% |
| $35,000 to $49,999 | 20.4% | 10.5% | 10.1% |
| $50,000 to $74,999 | 12.9% | 15.9% | 15.5% |
| $75,000 to $99,999 | 9.4% | 12.8% | 12.6% |
| $100,000 to $149,999 | 10.9% | 17.7% | 17.5% |
| $150,000 to $199,999 | 14.6% | 9.3% | 9.6% |
| $200,000 or more | 3.2% | 11.8% | 13.4% |
Source: U.S. Census ACS 5-year estimates (2024)


