Glens Falls SnackAbility
Overall SnackAbility
Crime in Glens Falls summary. We use data from the FBI to determine the crime rates in Glens Falls. Key points include:
There were 118 total crimes in Glens Falls in the last reporting year.
The overall crime rate per 100,000 people in Glens Falls is 818.5 / 100k people.
The violent crime rate per 100,000 people in Glens Falls is 159.5 / 100k people.
The property crime rate per 100,000 people in Glens Falls is 659.0 / 100k people.
Overall, crime in Glens Falls is -61.38% below the national average.
Total Crimes
Below National Average
Crime In Glens Falls Comparison Table
| Statistic | Count Raw |
Glens Falls / 100k People |
New York / 100k People |
National / 100k People |
|---|---|---|---|---|
| Total Crimes Per 100K | 118 | 818.5 | 2,099.7 | 2,119.2 |
| Violent Crime | 23 | 159.5 | 380.2 | 359.0 |
| Murder | 0 | 0.0 | 2.7 | 5.0 |
| Robbery | 2 | 13.9 | 96.1 | 61.0 |
| Aggravated Assault | 18 | 124.9 | 259.6 | 256.0 |
| Property Crime | 95 | 659.0 | 1,719.5 | 1,760.0 |
| Burglary | 10 | 69.4 | 136.6 | 229.0 |
| Larceny | 82 | 568.8 | 1,432.8 | 1,272.0 |
| Car Theft | 3 | 20.8 | 150.2 | 259.0 |
Source: FBI Uniform Crime Reporting (2024)
Cost of living in Glens Falls summary. We use data on the cost of living to determine how expensive it is to live in Glens Falls. Real estate prices drive most of the variance in cost of living around New York. Key points include:
The cost of living in Glens Falls is 104 with 100 being average.
The cost of living in Glens Falls is 1.0x higher than the national average.
The median home value in Glens Falls is $264,460.
The median income in Glens Falls is $67,788.
Glens Falls's Overall Cost Of Living
Higher Than The National Average
Cost Of Living In Glens Falls Comparison Table
| Living Expense | Glens Falls | New York | National Average |
|---|---|---|---|
| Overall | 104 | 121 | 100 |
| Services | 105 | 105 | 100 |
| Groceries | 109 | 108 | 100 |
| Health | 89 | 143 | 100 |
| Housing | 113 | 112 | 100 |
| Transportation | 112 | 114 | 100 |
| Utilities | 116 | 111 | 100 |
Source: Cost of living index, normalized to US average = 100
Glens Falls, NY Weather
The average high in Glens Falls is 57.2° and the average low is 35.8°.
There are 79.0 days of precipitation each year.
Expect an average of 39.8 inches of precipitation each year with 65.5 inches of snow.
| Stat | Glens Falls |
|---|---|
| Average Annual High | 57.2 |
| Average Annual Low | 35.8 |
| Annual Precipitation Days | 79.0 |
| Average Annual Precipitation | 39.8 |
| Average Annual Snowfall | 65.5 |
Average High
Days of Rain
Source: NOAA climate normals (30-year)
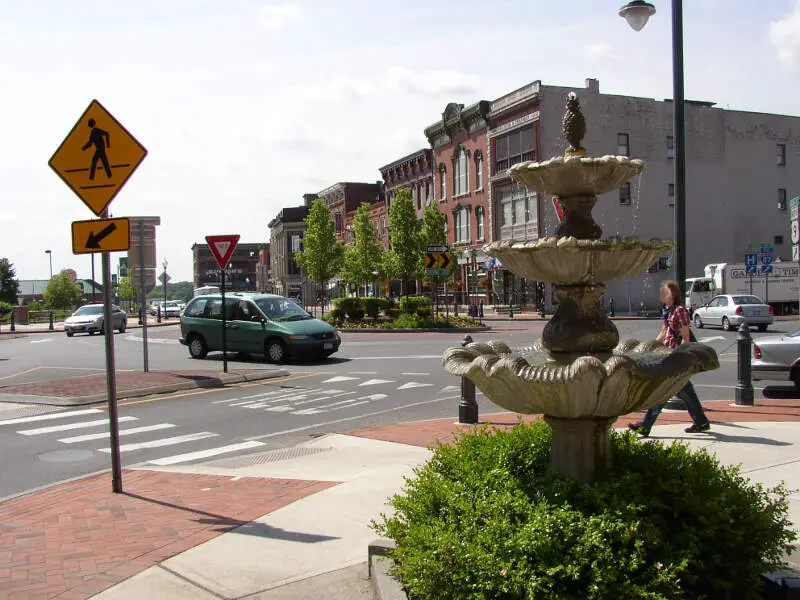
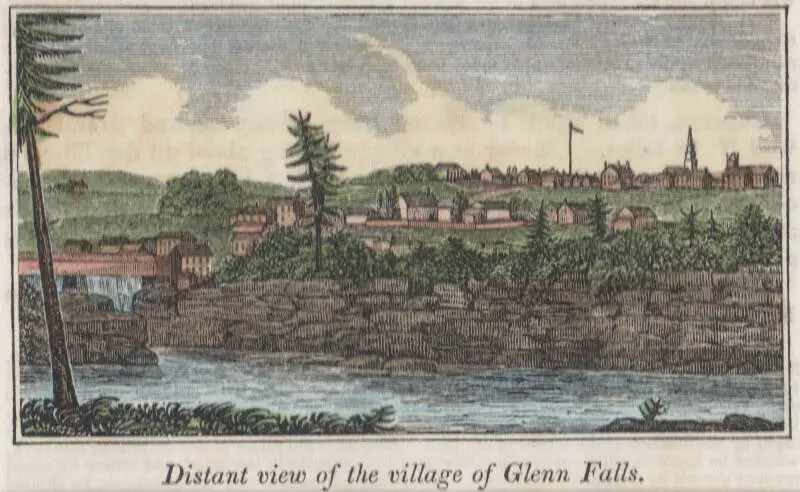
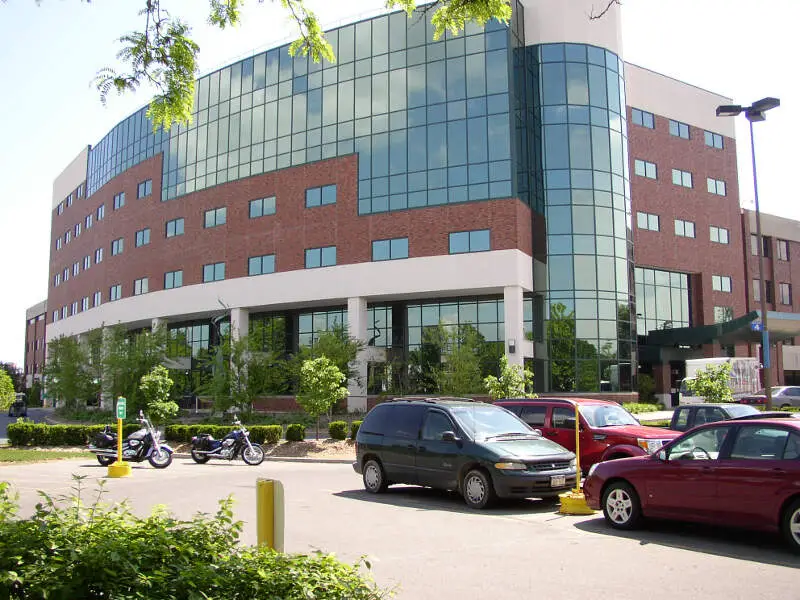
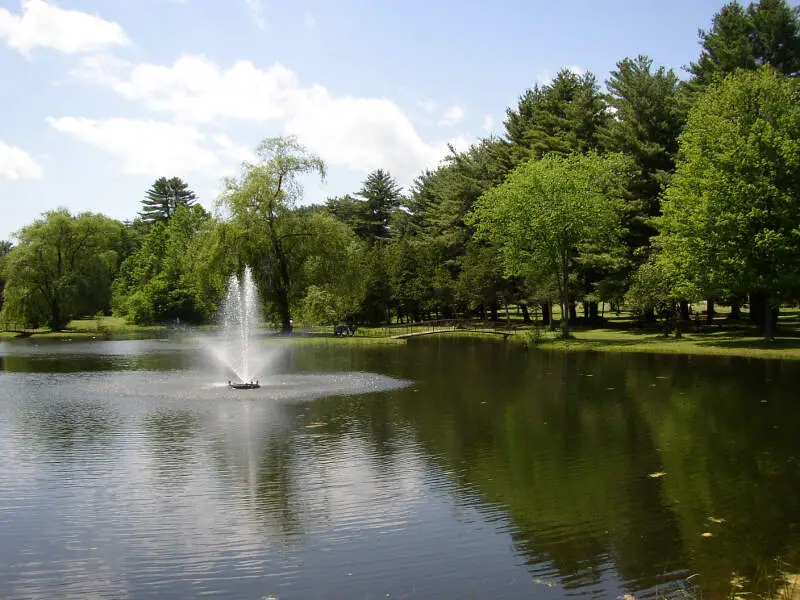
Glens Falls, NY Photos
Rankings & Articles For Glens Falls


Locations Around Glens Falls
Map Of Glens Falls, NY
Best Places Around Glens Falls
Colonie, NY
Population 7,702
Niskayuna, NY
Population 21,227
Westmere, NY
Population 8,334
Cohoes, NY
Population 18,159
Saratoga Springs, NY
Population 28,631
Rensselaer, NY
Population 9,287
Mechanicville, NY
Population 5,124
Scotia, NY
Population 7,264
Ballston Spa, NY
Population 5,027
Albany, NY
Population 100,492
Glens Falls Demographics And Statistics
Population over time in Glens Falls
The current population in Glens Falls is 14,609. The population has decreased 0.9% from 2010.
| Year | Population | % Change |
|---|---|---|
| 2024 | 14,609 | -0.5% |
| 2023 | 14,678 | -0.4% |
| 2022 | 14,743 | -0.3% |
| 2021 | 14,784 | 3.2% |
| 2020 | 14,322 | -0.1% |
| 2019 | 14,340 | -0.1% |
| 2018 | 14,359 | -0.5% |
| 2017 | 14,428 | 0.0% |
| 2016 | 14,422 | -0.5% |
| 2015 | 14,496 | -0.5% |
| 2014 | 14,574 | -0.5% |
| 2013 | 14,652 | -0.3% |
| 2012 | 14,696 | -0.3% |
| 2011 | 14,733 | -0.1% |
| 2010 | 14,747 | - |
Race / Ethnicity in Glens Falls
See the full breakdown
Glens Falls is:
87.7% White with 12,806 White residents.
3.4% African American with 502 African American residents.
0.0% American Indian with 3 American Indian residents.
0.7% Asian with 96 Asian residents.
0.0% Hawaiian with 0 Hawaiian residents.
0.3% Other with 44 Other residents.
4.0% Two Or More with 585 Two Or More residents.
3.9% Hispanic with 573 Hispanic residents.
| Race | Glens Falls | NY | USA |
|---|---|---|---|
| White | 87.7% | 52.8% | 57.4% |
| African American | 3.4% | 13.4% | 11.9% |
| American Indian | 0.0% | 0.2% | 0.5% |
| Asian | 0.7% | 9.0% | 5.9% |
| Hawaiian | 0.0% | 0.0% | 0.2% |
| Other | 0.3% | 1.0% | 0.6% |
| Two Or More | 4.0% | 3.8% | 4.3% |
| Hispanic | 3.9% | 19.8% | 19.3% |
Gender in Glens Falls
See the full breakdown
Glens Falls is 50.0% female with 7,302 female residents.
Glens Falls is 50.0% male with 7,306 male residents.
| Gender | Glens Falls | NY | USA |
|---|---|---|---|
| Female | 50.0% | 51.2% | 50.5% |
| Male | 50.0% | 48.8% | 49.5% |
Highest level of educational attainment in Glens Falls for adults over 25
See the full breakdown
2.0% of adults in Glens Falls completed < 9th grade.
6.0% of adults in Glens Falls completed 9-12th grade.
28.0% of adults in Glens Falls completed high school / ged.
17.0% of adults in Glens Falls completed some college.
13.0% of adults in Glens Falls completed associate's degree.
19.0% of adults in Glens Falls completed bachelor's degree.
12.0% of adults in Glens Falls completed master's degree.
2.0% of adults in Glens Falls completed professional degree.
1.0% of adults in Glens Falls completed doctorate degree.
| Education | Glens Falls | NY | USA |
|---|---|---|---|
| < 9th Grade | 2.0% | 6.0% | 4.0% |
| 9-12th Grade | 6.0% | 6.0% | 6.0% |
| High School / GED | 28.0% | 24.0% | 26.0% |
| Some College | 17.0% | 15.0% | 19.0% |
| Associate's Degree | 13.0% | 9.0% | 9.0% |
| Bachelor's Degree | 19.0% | 22.0% | 22.0% |
| Master's Degree | 12.0% | 13.0% | 10.0% |
| Professional Degree | 2.0% | 3.0% | 2.0% |
| Doctorate Degree | 1.0% | 2.0% | 2.0% |
Household Income For Glens Falls, New York
See the full breakdown
5.4% of households in Glens Falls earn Less than $10,000.
3.6% of households in Glens Falls earn $10,000 to $14,999.
6.6% of households in Glens Falls earn $15,000 to $24,999.
10.2% of households in Glens Falls earn $25,000 to $34,999.
11.5% of households in Glens Falls earn $35,000 to $49,999.
18.8% of households in Glens Falls earn $50,000 to $74,999.
13.8% of households in Glens Falls earn $75,000 to $99,999.
16.1% of households in Glens Falls earn $100,000 to $149,999.
7.8% of households in Glens Falls earn $150,000 to $199,999.
6.2% of households in Glens Falls earn $200,000 or more.
| Income | Glens Falls | NY | USA |
|---|---|---|---|
| Less than $10,000 | 5.4% | 5.8% | 5.0% |
| $10,000 to $14,999 | 3.6% | 3.9% | 3.4% |
| $15,000 to $24,999 | 6.6% | 6.3% | 6.3% |
| $25,000 to $34,999 | 10.2% | 6.2% | 6.6% |
| $35,000 to $49,999 | 11.5% | 8.9% | 10.1% |
| $50,000 to $74,999 | 18.8% | 13.6% | 15.5% |
| $75,000 to $99,999 | 13.8% | 11.4% | 12.6% |
| $100,000 to $149,999 | 16.1% | 16.7% | 17.5% |
| $150,000 to $199,999 | 7.8% | 10.1% | 9.6% |
| $200,000 or more | 6.2% | 17.1% | 13.4% |
Source: U.S. Census ACS 5-year estimates (2024)


