Hempstead SnackAbility
Overall SnackAbility
Cost of living in Hempstead summary. We use data on the cost of living to determine how expensive it is to live in Hempstead. Real estate prices drive most of the variance in cost of living around New York. Key points include:
The cost of living in Hempstead is 133 with 100 being average.
The cost of living in Hempstead is 1.3x higher than the national average.
The median home value in Hempstead is $627,530.
The median income in Hempstead is $90,420.
Hempstead's Overall Cost Of Living
Higher Than The National Average
Cost Of Living In Hempstead Comparison Table
| Living Expense | Hempstead | New York | National Average |
|---|---|---|---|
| Overall | 133 | 121 | 100 |
| Services | 107 | 105 | 100 |
| Groceries | 109 | 108 | 100 |
| Health | 179 | 143 | 100 |
| Housing | 110 | 112 | 100 |
| Transportation | 115 | 114 | 100 |
| Utilities | 108 | 111 | 100 |
Source: Cost of living index, normalized to US average = 100
Hempstead, NY Weather
The average high in Hempstead is None° and the average low is None°.
There are None days of precipitation each year.
Expect an average of None inches of precipitation each year with None inches of snow.
| Stat | Hempstead |
|---|---|
| Average Annual High | None |
| Average Annual Low | None |
| Annual Precipitation Days | None |
| Average Annual Precipitation | None |
| Average Annual Snowfall | None |
Average High
Days of Rain
Source: NOAA climate normals (30-year)
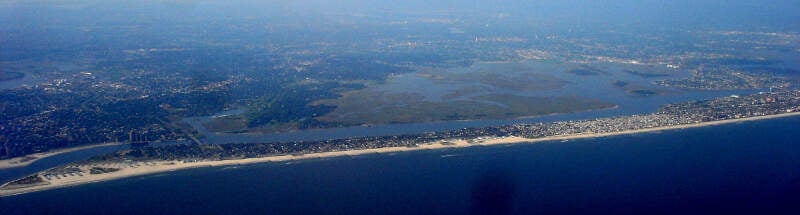
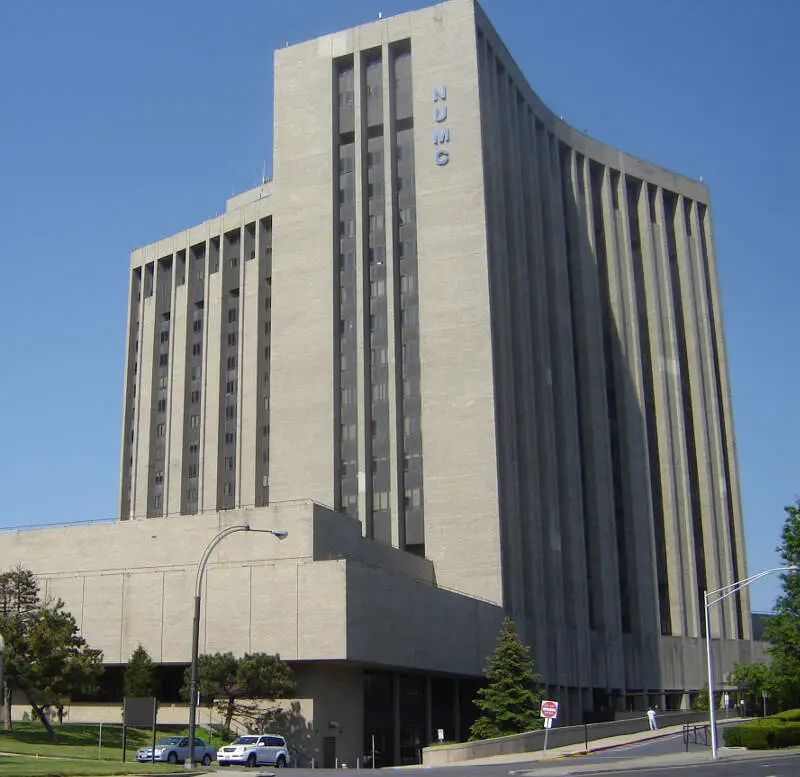
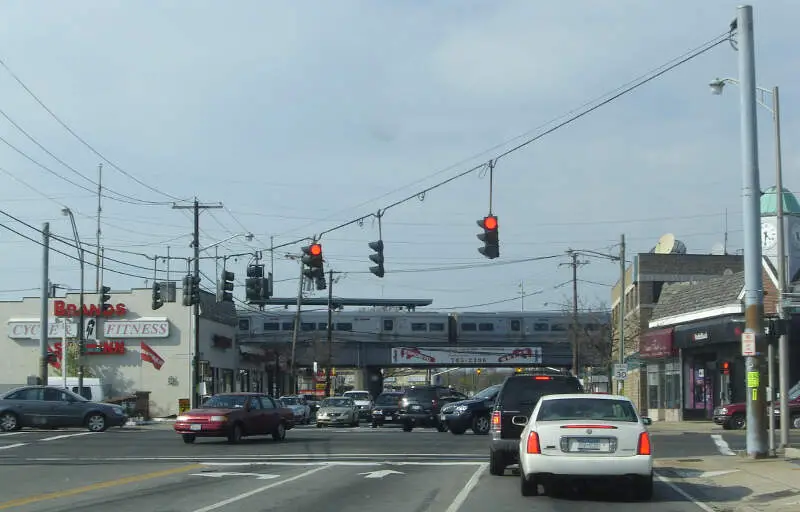
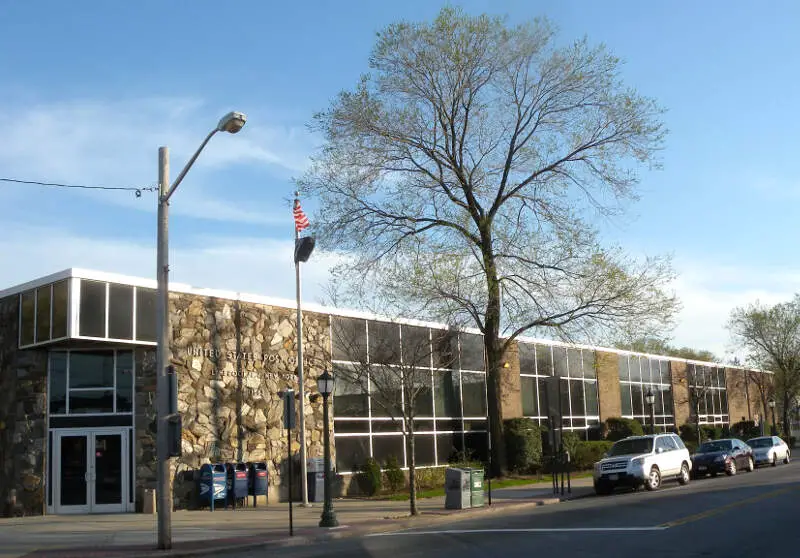
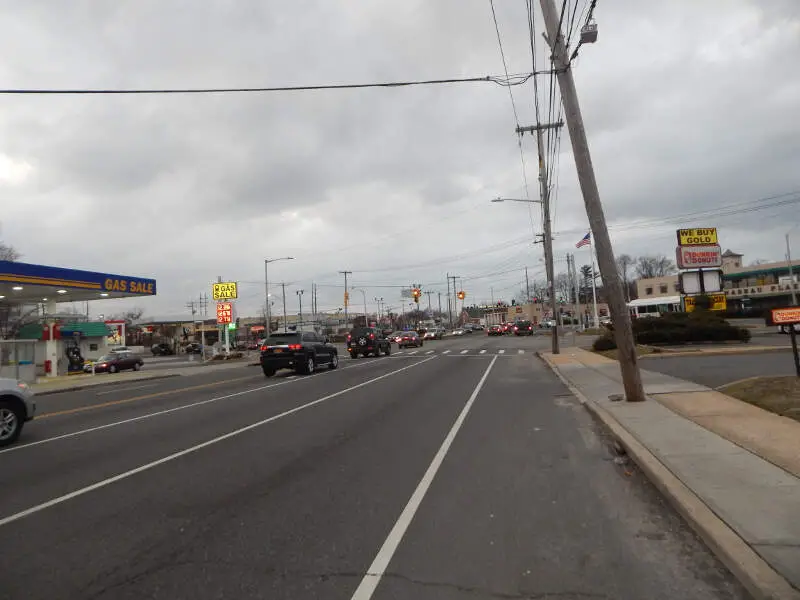
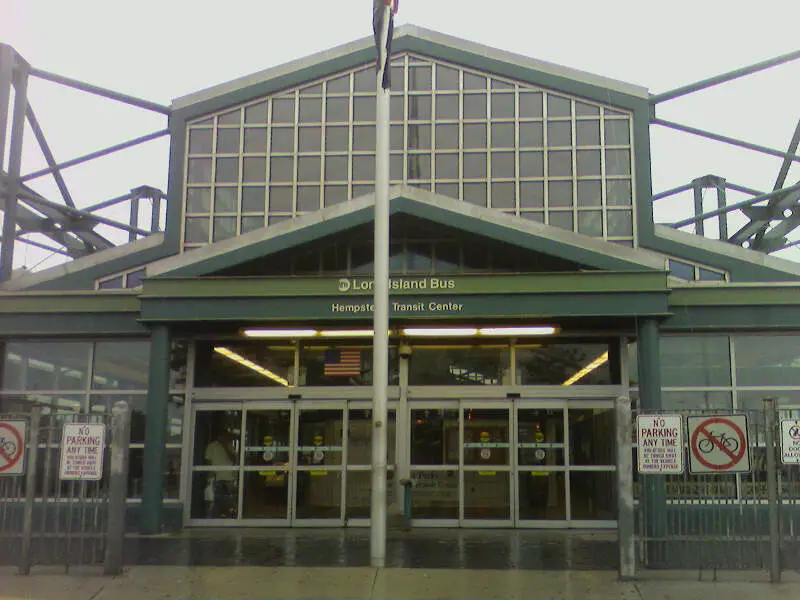
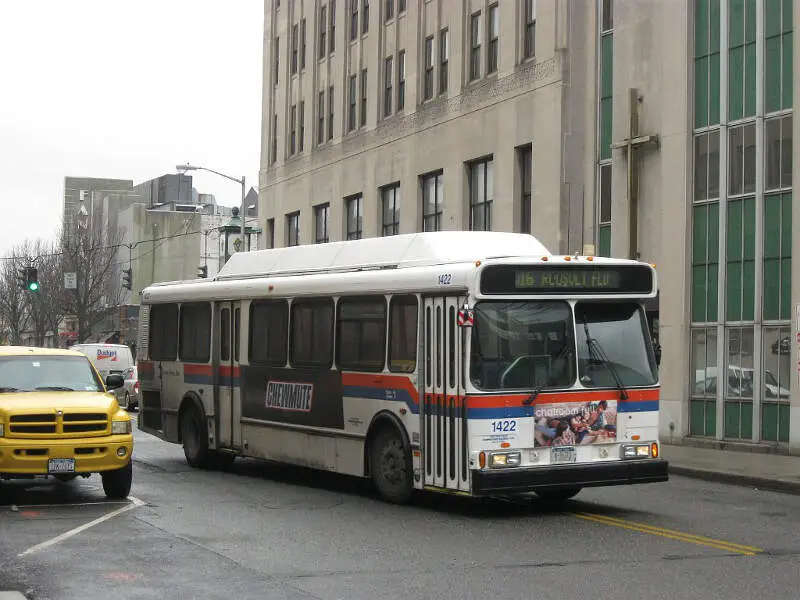
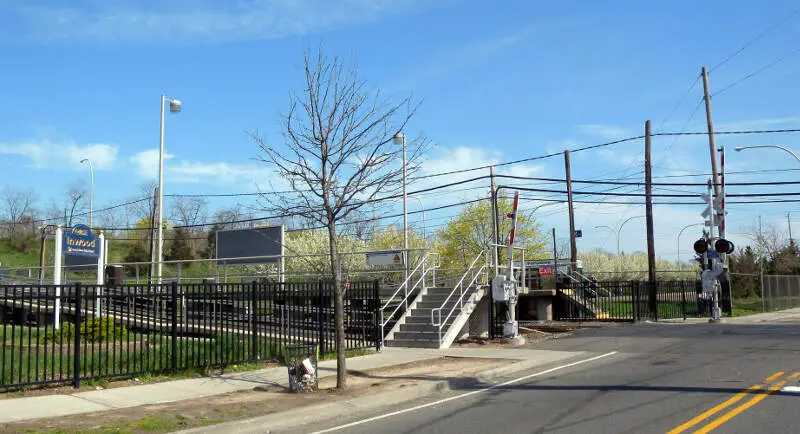
Hempstead, NY Photos

Rankings & Articles For Hempstead


Locations Around Hempstead
Map Of Hempstead, NY
Best Places Around Hempstead
Malverne, NY
Population 8,477
Plainview, NY
Population 25,982
Merrick, NY
Population 21,744
Woodmere, NY
Population 18,061
Syosset, NY
Population 18,433
Bronxville, NY
Population 6,510
Massapequa Park, NY
Population 16,963
Pelham Manor, NY
Population 5,644
Massapequa, NY
Population 21,389
Levittown, NY
Population 51,904
Hempstead Demographics And Statistics
Population over time in Hempstead
The current population in Hempstead is 58,801. The population has increased 10.2% from 2010.
| Year | Population | % Change |
|---|---|---|
| 2024 | 58,801 | 0.4% |
| 2023 | 58,569 | 0.0% |
| 2022 | 58,557 | 0.0% |
| 2021 | 58,532 | 6.1% |
| 2020 | 55,153 | -0.3% |
| 2019 | 55,300 | -0.2% |
| 2018 | 55,399 | -0.5% |
| 2017 | 55,698 | 0.4% |
| 2016 | 55,454 | 0.6% |
| 2015 | 55,105 | 0.6% |
| 2014 | 54,801 | 0.8% |
| 2013 | 54,350 | 0.8% |
| 2012 | 53,927 | 0.6% |
| 2011 | 53,584 | 0.4% |
| 2010 | 53,365 | - |
Race / Ethnicity in Hempstead
See the full breakdown
Hempstead is:
4.5% White with 2,629 White residents.
43.2% African American with 25,373 African American residents.
0.1% American Indian with 33 American Indian residents.
2.8% Asian with 1,632 Asian residents.
0.0% Hawaiian with 7 Hawaiian residents.
0.7% Other with 440 Other residents.
3.5% Two Or More with 2,029 Two Or More residents.
45.3% Hispanic with 26,658 Hispanic residents.
| Race | Hempstead | NY | USA |
|---|---|---|---|
| White | 4.5% | 52.8% | 57.4% |
| African American | 43.2% | 13.4% | 11.9% |
| American Indian | 0.1% | 0.2% | 0.5% |
| Asian | 2.8% | 9.0% | 5.9% |
| Hawaiian | 0.0% | 0.0% | 0.2% |
| Other | 0.7% | 1.0% | 0.6% |
| Two Or More | 3.5% | 3.8% | 4.3% |
| Hispanic | 45.3% | 19.8% | 19.3% |
Gender in Hempstead
See the full breakdown
Hempstead is 50.9% female with 29,937 female residents.
Hempstead is 49.1% male with 28,864 male residents.
| Gender | Hempstead | NY | USA |
|---|---|---|---|
| Female | 50.9% | 51.2% | 50.5% |
| Male | 49.1% | 48.8% | 49.5% |
Highest level of educational attainment in Hempstead for adults over 25
See the full breakdown
14.0% of adults in Hempstead completed < 9th grade.
10.0% of adults in Hempstead completed 9-12th grade.
31.0% of adults in Hempstead completed high school / ged.
16.0% of adults in Hempstead completed some college.
7.0% of adults in Hempstead completed associate's degree.
12.0% of adults in Hempstead completed bachelor's degree.
8.0% of adults in Hempstead completed master's degree.
1.0% of adults in Hempstead completed professional degree.
1.0% of adults in Hempstead completed doctorate degree.
| Education | Hempstead | NY | USA |
|---|---|---|---|
| < 9th Grade | 14.0% | 6.0% | 4.0% |
| 9-12th Grade | 10.0% | 6.0% | 6.0% |
| High School / GED | 31.0% | 24.0% | 26.0% |
| Some College | 16.0% | 15.0% | 19.0% |
| Associate's Degree | 7.0% | 9.0% | 9.0% |
| Bachelor's Degree | 12.0% | 22.0% | 22.0% |
| Master's Degree | 8.0% | 13.0% | 10.0% |
| Professional Degree | 1.0% | 3.0% | 2.0% |
| Doctorate Degree | 1.0% | 2.0% | 2.0% |
Household Income For Hempstead, New York
See the full breakdown
5.5% of households in Hempstead earn Less than $10,000.
4.5% of households in Hempstead earn $10,000 to $14,999.
7.3% of households in Hempstead earn $15,000 to $24,999.
5.6% of households in Hempstead earn $25,000 to $34,999.
8.8% of households in Hempstead earn $35,000 to $49,999.
14.4% of households in Hempstead earn $50,000 to $74,999.
7.1% of households in Hempstead earn $75,000 to $99,999.
20.0% of households in Hempstead earn $100,000 to $149,999.
9.9% of households in Hempstead earn $150,000 to $199,999.
17.0% of households in Hempstead earn $200,000 or more.
| Income | Hempstead | NY | USA |
|---|---|---|---|
| Less than $10,000 | 5.5% | 5.8% | 5.0% |
| $10,000 to $14,999 | 4.5% | 3.9% | 3.4% |
| $15,000 to $24,999 | 7.3% | 6.3% | 6.3% |
| $25,000 to $34,999 | 5.6% | 6.2% | 6.6% |
| $35,000 to $49,999 | 8.8% | 8.9% | 10.1% |
| $50,000 to $74,999 | 14.4% | 13.6% | 15.5% |
| $75,000 to $99,999 | 7.1% | 11.4% | 12.6% |
| $100,000 to $149,999 | 20.0% | 16.7% | 17.5% |
| $150,000 to $199,999 | 9.9% | 10.1% | 9.6% |
| $200,000 or more | 17.0% | 17.1% | 13.4% |
Source: U.S. Census ACS 5-year estimates (2024)


