Kings Point SnackAbility
Overall SnackAbility
Kings Point, NY Weather
The average high in Kings Point is 61.8° and the average low is 45.3°.
There are 75.9 days of precipitation each year.
Expect an average of 47.6 inches of precipitation each year with 22.7 inches of snow.
| Stat | Kings Point |
|---|---|
| Average Annual High | 61.8 |
| Average Annual Low | 45.3 |
| Annual Precipitation Days | 75.9 |
| Average Annual Precipitation | 47.6 |
| Average Annual Snowfall | 22.7 |
Average High
Days of Rain
Source: NOAA climate normals (30-year)
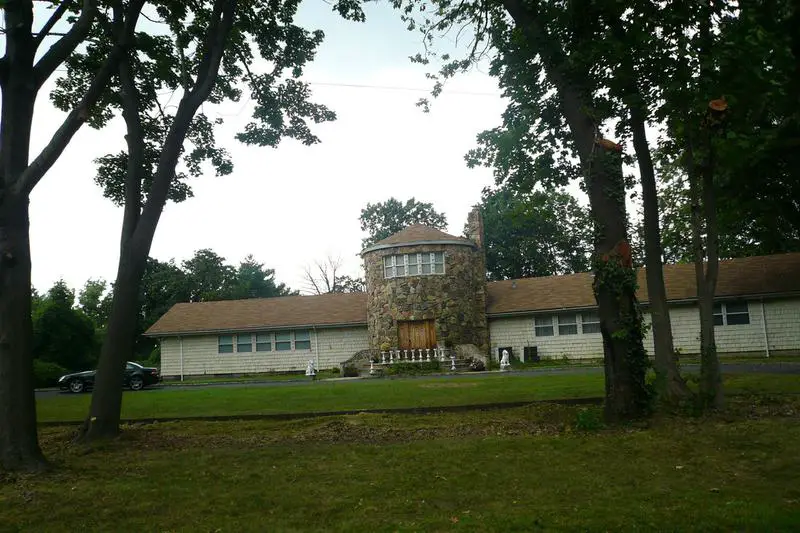
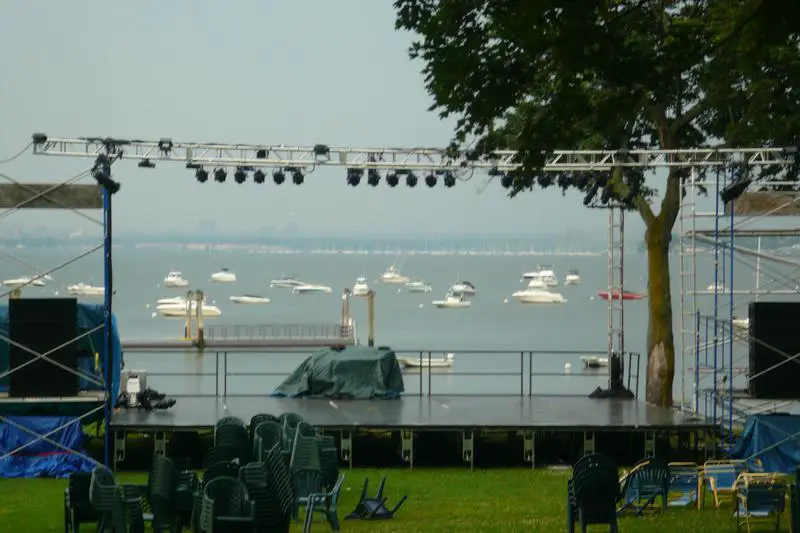
Kings Point, NY Photos
Rankings & Articles For Kings Point


Locations Around Kings Point
Map Of Kings Point, NY
Best Places Around Kings Point
Malverne, NY
Population 8,477
Plainview, NY
Population 25,982
Merrick, NY
Population 21,744
Woodmere, NY
Population 18,061
Syosset, NY
Population 18,433
Bronxville, NY
Population 6,510
Massapequa Park, NY
Population 16,963
Pelham Manor, NY
Population 5,644
Massapequa, NY
Population 21,389
Levittown, NY
Population 51,904
Kings Point Demographics And Statistics
Population over time in Kings Point
The current population in Kings Point is 5,634. The population has increased 13.3% from 2010.
| Year | Population | % Change |
|---|---|---|
| 2024 | 5,634 | 0.4% |
| 2023 | 5,614 | 0.4% |
| 2022 | 5,593 | 1.8% |
| 2021 | 5,493 | 4.6% |
| 2020 | 5,250 | 0.5% |
| 2019 | 5,223 | 0.7% |
| 2018 | 5,187 | 0.1% |
| 2017 | 5,181 | 0.8% |
| 2016 | 5,140 | 1.4% |
| 2015 | 5,071 | -0.1% |
| 2014 | 5,076 | 1.2% |
| 2013 | 5,016 | 0.1% |
| 2012 | 5,011 | 0.4% |
| 2011 | 4,993 | 0.4% |
| 2010 | 4,974 | - |
Race / Ethnicity in Kings Point
See the full breakdown
Kings Point is:
93.1% White with 5,248 White residents.
0.6% African American with 31 African American residents.
0.0% American Indian with 0 American Indian residents.
2.7% Asian with 152 Asian residents.
0.3% Hawaiian with 17 Hawaiian residents.
0.2% Other with 14 Other residents.
2.1% Two Or More with 119 Two Or More residents.
0.9% Hispanic with 53 Hispanic residents.
| Race | Kings Point | NY | USA |
|---|---|---|---|
| White | 93.1% | 52.8% | 57.4% |
| African American | 0.6% | 13.4% | 11.9% |
| American Indian | 0.0% | 0.2% | 0.5% |
| Asian | 2.7% | 9.0% | 5.9% |
| Hawaiian | 0.3% | 0.0% | 0.2% |
| Other | 0.2% | 1.0% | 0.6% |
| Two Or More | 2.1% | 3.8% | 4.3% |
| Hispanic | 0.9% | 19.8% | 19.3% |
Gender in Kings Point
See the full breakdown
Kings Point is 49.3% female with 2,776 female residents.
Kings Point is 50.7% male with 2,858 male residents.
| Gender | Kings Point | NY | USA |
|---|---|---|---|
| Female | 49.3% | 51.2% | 50.5% |
| Male | 50.7% | 48.8% | 49.5% |
Highest level of educational attainment in Kings Point for adults over 25
See the full breakdown
2.0% of adults in Kings Point completed < 9th grade.
4.0% of adults in Kings Point completed 9-12th grade.
15.0% of adults in Kings Point completed high school / ged.
7.0% of adults in Kings Point completed some college.
5.0% of adults in Kings Point completed associate's degree.
33.0% of adults in Kings Point completed bachelor's degree.
20.0% of adults in Kings Point completed master's degree.
12.0% of adults in Kings Point completed professional degree.
2.0% of adults in Kings Point completed doctorate degree.
| Education | Kings Point | NY | USA |
|---|---|---|---|
| < 9th Grade | 2.0% | 6.0% | 4.0% |
| 9-12th Grade | 4.0% | 6.0% | 6.0% |
| High School / GED | 15.0% | 24.0% | 26.0% |
| Some College | 7.0% | 15.0% | 19.0% |
| Associate's Degree | 5.0% | 9.0% | 9.0% |
| Bachelor's Degree | 33.0% | 22.0% | 22.0% |
| Master's Degree | 20.0% | 13.0% | 10.0% |
| Professional Degree | 12.0% | 3.0% | 2.0% |
| Doctorate Degree | 2.0% | 2.0% | 2.0% |
Household Income For Kings Point, New York
See the full breakdown
1.6% of households in Kings Point earn Less than $10,000.
1.0% of households in Kings Point earn $10,000 to $14,999.
2.1% of households in Kings Point earn $15,000 to $24,999.
1.8% of households in Kings Point earn $25,000 to $34,999.
6.3% of households in Kings Point earn $35,000 to $49,999.
8.6% of households in Kings Point earn $50,000 to $74,999.
7.8% of households in Kings Point earn $75,000 to $99,999.
7.9% of households in Kings Point earn $100,000 to $149,999.
10.1% of households in Kings Point earn $150,000 to $199,999.
52.9% of households in Kings Point earn $200,000 or more.
| Income | Kings Point | NY | USA |
|---|---|---|---|
| Less than $10,000 | 1.6% | 5.8% | 5.0% |
| $10,000 to $14,999 | 1.0% | 3.9% | 3.4% |
| $15,000 to $24,999 | 2.1% | 6.3% | 6.3% |
| $25,000 to $34,999 | 1.8% | 6.2% | 6.6% |
| $35,000 to $49,999 | 6.3% | 8.9% | 10.1% |
| $50,000 to $74,999 | 8.6% | 13.6% | 15.5% |
| $75,000 to $99,999 | 7.8% | 11.4% | 12.6% |
| $100,000 to $149,999 | 7.9% | 16.7% | 17.5% |
| $150,000 to $199,999 | 10.1% | 10.1% | 9.6% |
| $200,000 or more | 52.9% | 17.1% | 13.4% |
Source: U.S. Census ACS 5-year estimates (2024)


