Poughkeepsie SnackAbility
Overall SnackAbility
Crime in Poughkeepsie summary. We use data from the FBI to determine the crime rates in Poughkeepsie. Key points include:
There were 726 total crimes in Poughkeepsie in the last reporting year.
The overall crime rate per 100,000 people in Poughkeepsie is 2,279.9 / 100k people.
The violent crime rate per 100,000 people in Poughkeepsie is 643.8 / 100k people.
The property crime rate per 100,000 people in Poughkeepsie is 1,636.2 / 100k people.
Overall, crime in Poughkeepsie is 7.58% above the national average.
Total Crimes
Above National Average
Crime In Poughkeepsie Comparison Table
| Statistic | Count Raw |
Poughkeepsie / 100k People |
New York / 100k People |
National / 100k People |
|---|---|---|---|---|
| Total Crimes Per 100K | 726 | 2,279.9 | 2,099.7 | 2,119.2 |
| Violent Crime | 205 | 643.8 | 380.2 | 359.0 |
| Murder | 2 | 6.3 | 2.7 | 5.0 |
| Robbery | 33 | 103.6 | 96.1 | 61.0 |
| Aggravated Assault | 150 | 471.1 | 259.6 | 256.0 |
| Property Crime | 521 | 1,636.2 | 1,719.5 | 1,760.0 |
| Burglary | 78 | 245.0 | 136.6 | 229.0 |
| Larceny | 403 | 1,265.6 | 1,432.8 | 1,272.0 |
| Car Theft | 40 | 125.6 | 150.2 | 259.0 |
Source: FBI Uniform Crime Reporting (2024)
Cost of living in Poughkeepsie summary. We use data on the cost of living to determine how expensive it is to live in Poughkeepsie. Real estate prices drive most of the variance in cost of living around New York. Key points include:
The cost of living in Poughkeepsie is 113 with 100 being average.
The cost of living in Poughkeepsie is 1.1x higher than the national average.
The median home value in Poughkeepsie is $339,927.
The median income in Poughkeepsie is $60,741.
Poughkeepsie's Overall Cost Of Living
Higher Than The National Average
Cost Of Living In Poughkeepsie Comparison Table
| Living Expense | Poughkeepsie | New York | National Average |
|---|---|---|---|
| Overall | 113 | 121 | 100 |
| Services | 108 | 105 | 100 |
| Groceries | 108 | 108 | 100 |
| Health | 115 | 143 | 100 |
| Housing | 109 | 112 | 100 |
| Transportation | 109 | 114 | 100 |
| Utilities | 113 | 111 | 100 |
Source: Cost of living index, normalized to US average = 100
Poughkeepsie, NY Weather
The average high in Poughkeepsie is 61.2° and the average low is 39.5°.
There are 81.2 days of precipitation each year.
Expect an average of 43.7 inches of precipitation each year with 42.9 inches of snow.
| Stat | Poughkeepsie |
|---|---|
| Average Annual High | 61.2 |
| Average Annual Low | 39.5 |
| Annual Precipitation Days | 81.2 |
| Average Annual Precipitation | 43.7 |
| Average Annual Snowfall | 42.9 |
Average High
Days of Rain
Source: NOAA climate normals (30-year)
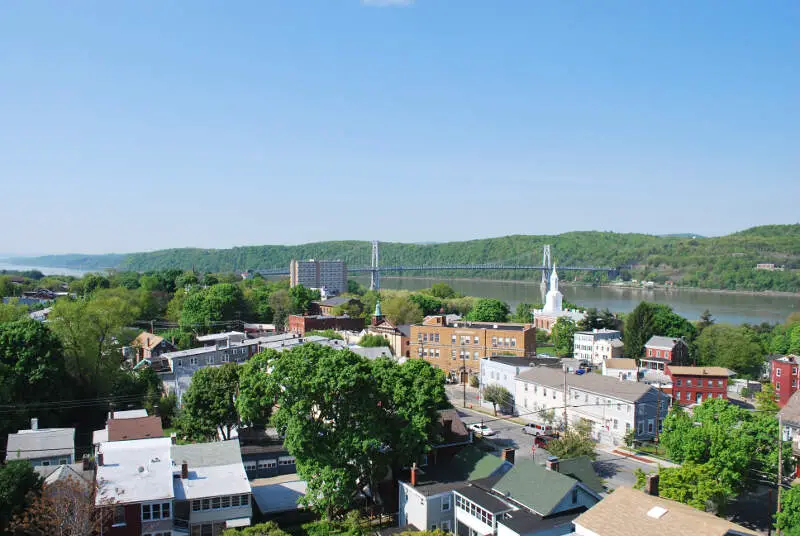
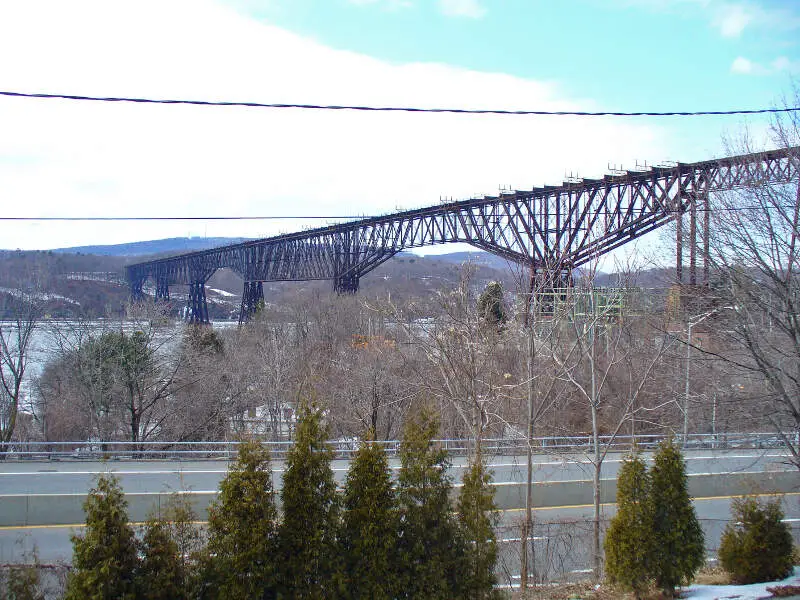
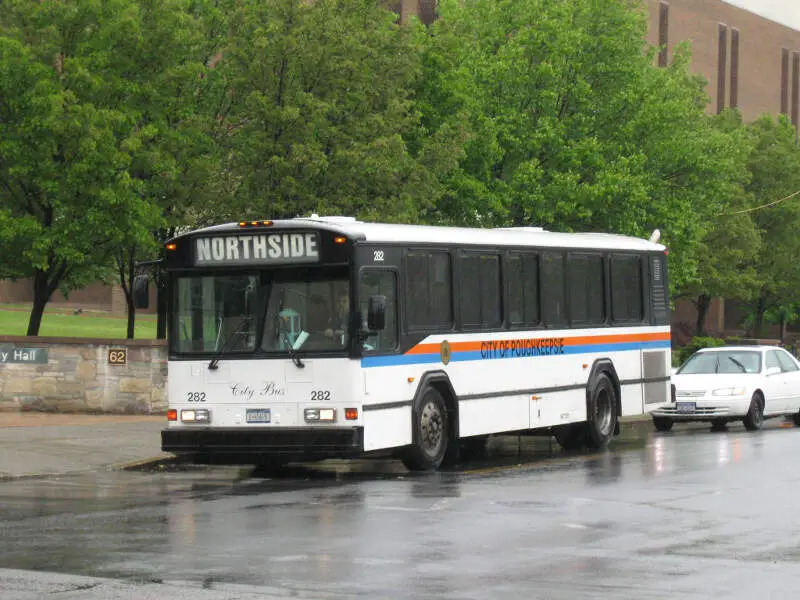
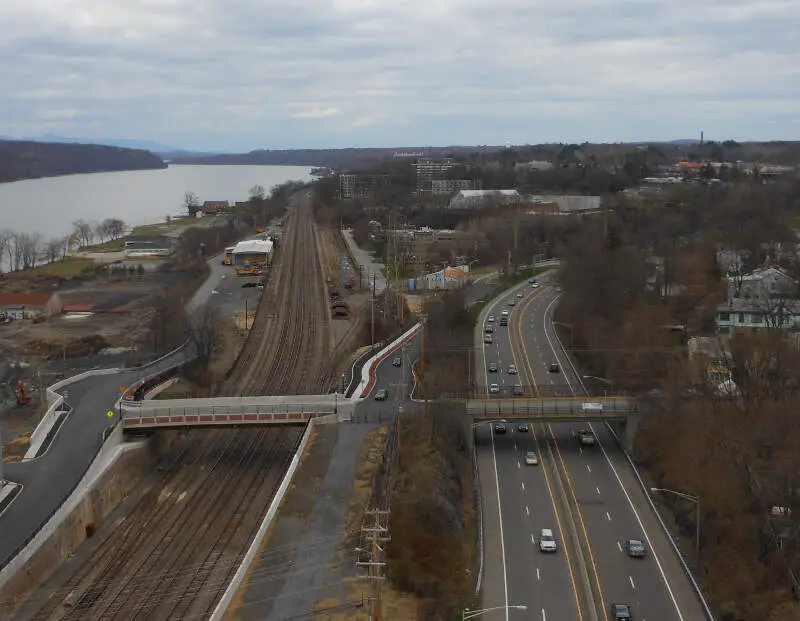
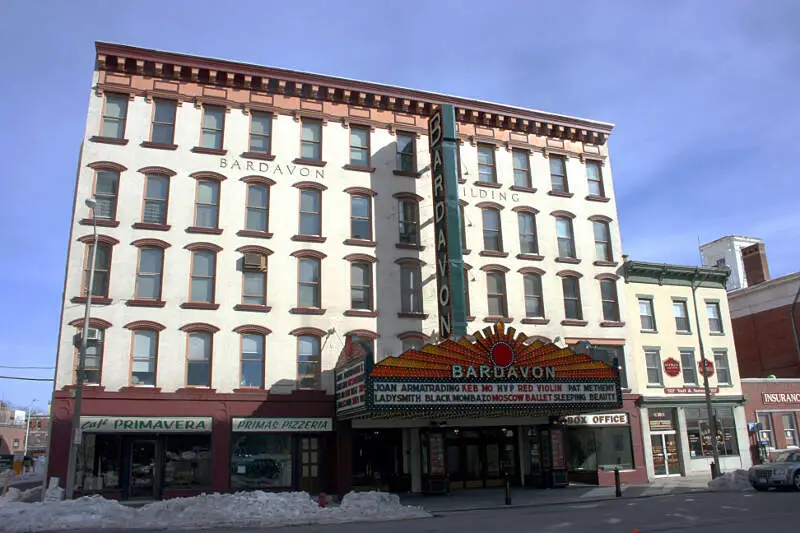
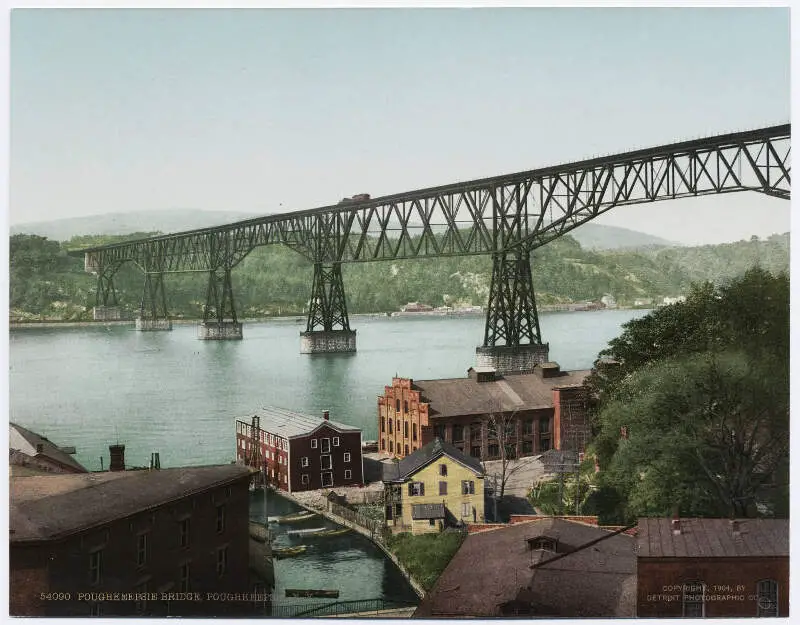
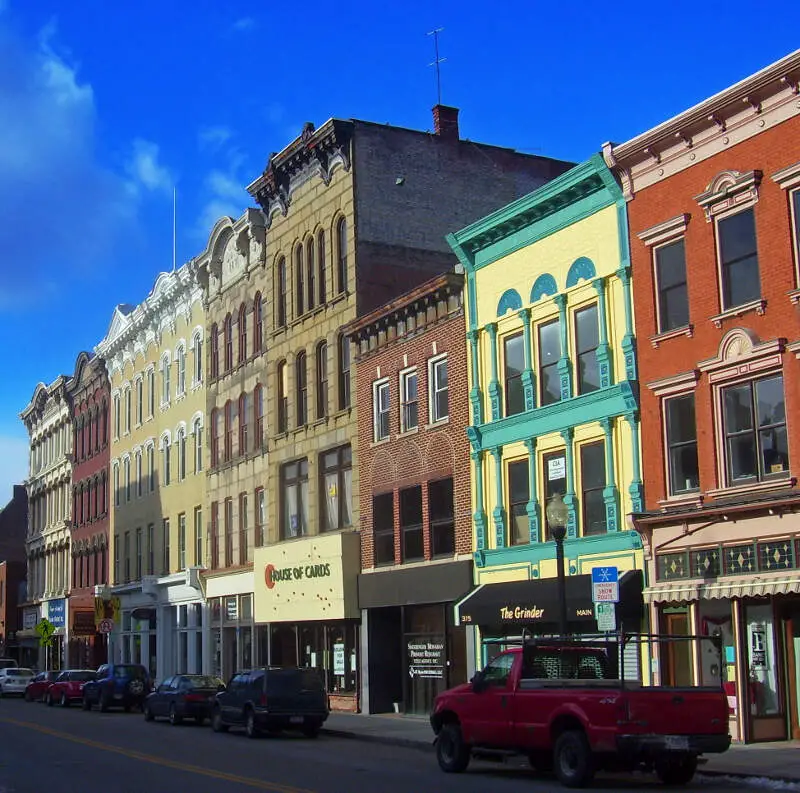
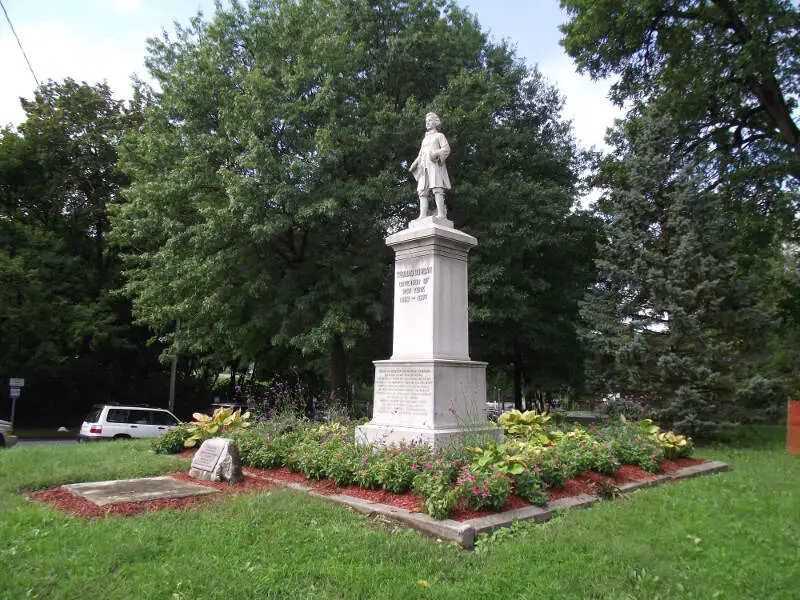
Poughkeepsie, NY Photos

Rankings & Articles For Poughkeepsie


Locations Around Poughkeepsie
Map Of Poughkeepsie, NY
Best Places Around Poughkeepsie
Myers Corner, NY
Population 10,877
Orange Lake, NY
Population 9,784
New Windsor, NY
Population 8,919
Walden, NY
Population 6,868
Wappingers Falls, NY
Population 5,761
New Paltz, NY
Population 8,314
Beacon, NY
Population 14,834
Newburgh, NY
Population 28,519
Highland, NY
Population 6,367
Poughkeepsie Demographics And Statistics
Population over time in Poughkeepsie
The current population in Poughkeepsie is 31,958. The population has decreased 1.5% from 2010.
| Year | Population | % Change |
|---|---|---|
| 2024 | 31,958 | 0.6% |
| 2023 | 31,778 | 0.2% |
| 2022 | 31,717 | 0.8% |
| 2021 | 31,475 | 3.7% |
| 2020 | 30,341 | -0.1% |
| 2019 | 30,381 | 0.1% |
| 2018 | 30,356 | -0.5% |
| 2017 | 30,505 | -0.0% |
| 2016 | 30,511 | -0.4% |
| 2015 | 30,635 | -0.3% |
| 2014 | 30,716 | -1.5% |
| 2013 | 31,172 | -1.3% |
| 2012 | 31,593 | -3.0% |
| 2011 | 32,564 | 0.4% |
| 2010 | 32,441 | - |
Race / Ethnicity in Poughkeepsie
See the full breakdown
Poughkeepsie is:
32.8% White with 10,497 White residents.
30.0% African American with 9,584 African American residents.
0.0% American Indian with 5 American Indian residents.
1.6% Asian with 496 Asian residents.
0.0% Hawaiian with 0 Hawaiian residents.
1.3% Other with 427 Other residents.
6.8% Two Or More with 2,173 Two Or More residents.
27.5% Hispanic with 8,776 Hispanic residents.
| Race | Poughkeepsie | NY | USA |
|---|---|---|---|
| White | 32.8% | 52.8% | 57.4% |
| African American | 30.0% | 13.4% | 11.9% |
| American Indian | 0.0% | 0.2% | 0.5% |
| Asian | 1.6% | 9.0% | 5.9% |
| Hawaiian | 0.0% | 0.0% | 0.2% |
| Other | 1.3% | 1.0% | 0.6% |
| Two Or More | 6.8% | 3.8% | 4.3% |
| Hispanic | 27.5% | 19.8% | 19.3% |
Gender in Poughkeepsie
See the full breakdown
Poughkeepsie is 52.6% female with 16,812 female residents.
Poughkeepsie is 47.4% male with 15,145 male residents.
| Gender | Poughkeepsie | NY | USA |
|---|---|---|---|
| Female | 52.6% | 51.2% | 50.5% |
| Male | 47.4% | 48.8% | 49.5% |
Highest level of educational attainment in Poughkeepsie for adults over 25
See the full breakdown
4.0% of adults in Poughkeepsie completed < 9th grade.
7.0% of adults in Poughkeepsie completed 9-12th grade.
31.0% of adults in Poughkeepsie completed high school / ged.
18.0% of adults in Poughkeepsie completed some college.
8.0% of adults in Poughkeepsie completed associate's degree.
16.0% of adults in Poughkeepsie completed bachelor's degree.
12.0% of adults in Poughkeepsie completed master's degree.
2.0% of adults in Poughkeepsie completed professional degree.
2.0% of adults in Poughkeepsie completed doctorate degree.
| Education | Poughkeepsie | NY | USA |
|---|---|---|---|
| < 9th Grade | 4.0% | 6.0% | 4.0% |
| 9-12th Grade | 7.0% | 6.0% | 6.0% |
| High School / GED | 31.0% | 24.0% | 26.0% |
| Some College | 18.0% | 15.0% | 19.0% |
| Associate's Degree | 8.0% | 9.0% | 9.0% |
| Bachelor's Degree | 16.0% | 22.0% | 22.0% |
| Master's Degree | 12.0% | 13.0% | 10.0% |
| Professional Degree | 2.0% | 3.0% | 2.0% |
| Doctorate Degree | 2.0% | 2.0% | 2.0% |
Household Income For Poughkeepsie, New York
See the full breakdown
7.1% of households in Poughkeepsie earn Less than $10,000.
5.4% of households in Poughkeepsie earn $10,000 to $14,999.
7.8% of households in Poughkeepsie earn $15,000 to $24,999.
10.1% of households in Poughkeepsie earn $25,000 to $34,999.
11.3% of households in Poughkeepsie earn $35,000 to $49,999.
17.1% of households in Poughkeepsie earn $50,000 to $74,999.
11.0% of households in Poughkeepsie earn $75,000 to $99,999.
16.2% of households in Poughkeepsie earn $100,000 to $149,999.
5.8% of households in Poughkeepsie earn $150,000 to $199,999.
8.3% of households in Poughkeepsie earn $200,000 or more.
| Income | Poughkeepsie | NY | USA |
|---|---|---|---|
| Less than $10,000 | 7.1% | 5.8% | 5.0% |
| $10,000 to $14,999 | 5.4% | 3.9% | 3.4% |
| $15,000 to $24,999 | 7.8% | 6.3% | 6.3% |
| $25,000 to $34,999 | 10.1% | 6.2% | 6.6% |
| $35,000 to $49,999 | 11.3% | 8.9% | 10.1% |
| $50,000 to $74,999 | 17.1% | 13.6% | 15.5% |
| $75,000 to $99,999 | 11.0% | 11.4% | 12.6% |
| $100,000 to $149,999 | 16.2% | 16.7% | 17.5% |
| $150,000 to $199,999 | 5.8% | 10.1% | 9.6% |
| $200,000 or more | 8.3% | 17.1% | 13.4% |
Source: U.S. Census ACS 5-year estimates (2024)


