Cuyahoga Falls SnackAbility
Overall SnackAbility
Crime in Cuyahoga Falls summary. We use data from the FBI to determine the crime rates in Cuyahoga Falls. Key points include:
There were 1,023 total crimes in Cuyahoga Falls in the last reporting year.
The overall crime rate per 100,000 people in Cuyahoga Falls is 2,020.2 / 100k people.
The violent crime rate per 100,000 people in Cuyahoga Falls is 173.8 / 100k people.
The property crime rate per 100,000 people in Cuyahoga Falls is 1,846.4 / 100k people.
Overall, crime in Cuyahoga Falls is -4.67% below the national average.
Total Crimes
Below National Average
Crime In Cuyahoga Falls Comparison Table
| Statistic | Count Raw |
Cuyahoga Falls / 100k People |
Ohio / 100k People |
National / 100k People |
|---|---|---|---|---|
| Total Crimes Per 100K | 1,023 | 2,020.2 | 1,844.9 | 2,119.2 |
| Violent Crime | 88 | 173.8 | 293.7 | 359.0 |
| Murder | 0 | 0.0 | 5.0 | 5.0 |
| Robbery | 5 | 9.9 | 45.5 | 61.0 |
| Aggravated Assault | 69 | 136.3 | 197.4 | 256.0 |
| Property Crime | 935 | 1,846.4 | 1,551.2 | 1,760.0 |
| Burglary | 63 | 124.4 | 206.0 | 229.0 |
| Larceny | 827 | 1,633.1 | 1,132.8 | 1,272.0 |
| Car Theft | 45 | 88.9 | 212.5 | 259.0 |
Source: FBI Uniform Crime Reporting (2024)
Cost of living in Cuyahoga Falls summary. We use data on the cost of living to determine how expensive it is to live in Cuyahoga Falls. Real estate prices drive most of the variance in cost of living around Ohio. Key points include:
The cost of living in Cuyahoga Falls is 93 with 100 being average.
The cost of living in Cuyahoga Falls is 0.9x lower than the national average.
The median home value in Cuyahoga Falls is $213,993.
The median income in Cuyahoga Falls is $72,705.
Cuyahoga Falls's Overall Cost Of Living
Lower Than The National Average
Cost Of Living In Cuyahoga Falls Comparison Table
| Living Expense | Cuyahoga Falls | Ohio | National Average |
|---|---|---|---|
| Overall | 93 | 90 | 100 |
| Services | 101 | 97 | 100 |
| Groceries | 98 | 97 | 100 |
| Health | 80 | 75 | 100 |
| Housing | 94 | 97 | 100 |
| Transportation | 93 | 95 | 100 |
| Utilities | 94 | 97 | 100 |
Source: Cost of living index, normalized to US average = 100
Cuyahoga Falls, OH Weather
The average high in Cuyahoga Falls is 59.4° and the average low is 41.9°.
There are 76.8 days of precipitation each year.
Expect an average of 37.5 inches of precipitation each year with 42.8 inches of snow.
| Stat | Cuyahoga Falls |
|---|---|
| Average Annual High | 59.4 |
| Average Annual Low | 41.9 |
| Annual Precipitation Days | 76.8 |
| Average Annual Precipitation | 37.5 |
| Average Annual Snowfall | 42.8 |
Average High
Days of Rain
Source: NOAA climate normals (30-year)
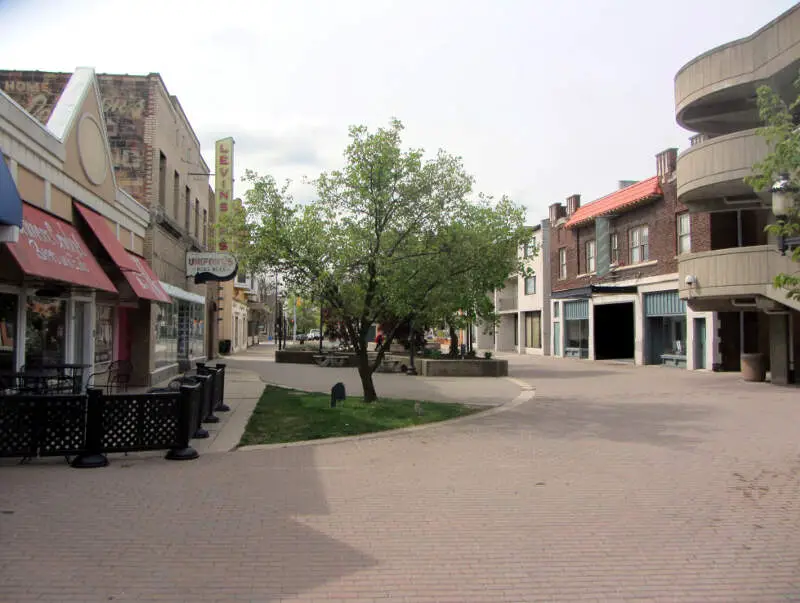
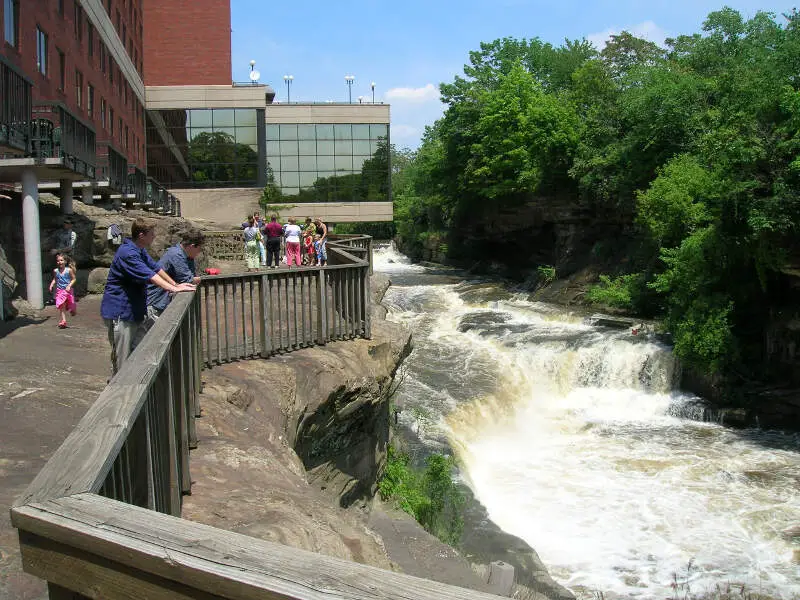
Cuyahoga Falls, OH Photos
1 Reviews & Comments About Cuyahoga Falls

I live in Cuyahoga Falls, which is a great city. Although it's really close to Akron, which isn't the best...
Rankings & Articles For Cuyahoga Falls


Locations Around Cuyahoga Falls
Map Of Cuyahoga Falls, OH
Best Places Around Cuyahoga Falls
Hudson, OH
Population 23,039
Macedonia, OH
Population 12,152
Solon, OH
Population 23,943
Broadview Heights, OH
Population 19,771
Munroe Falls, OH
Population 5,000
Strongsville, OH
Population 45,983
Stow, OH
Population 34,240
Seven Hills, OH
Population 11,603
Oakwood, OH
Population 9,458
Twinsburg, OH
Population 19,410
Cuyahoga Falls Demographics And Statistics
Population over time in Cuyahoga Falls
The current population in Cuyahoga Falls is 50,909. The population has increased 2.4% from 2010.
| Year | Population | % Change |
|---|---|---|
| 2024 | 50,909 | 0.1% |
| 2023 | 50,864 | -0.1% |
| 2022 | 50,916 | 0.0% |
| 2021 | 50,906 | 3.5% |
| 2020 | 49,191 | -0.0% |
| 2019 | 49,192 | -0.3% |
| 2018 | 49,317 | -0.0% |
| 2017 | 49,329 | -0.0% |
| 2016 | 49,353 | 0.1% |
| 2015 | 49,287 | -0.1% |
| 2014 | 49,316 | -0.2% |
| 2013 | 49,430 | -0.2% |
| 2012 | 49,513 | -0.3% |
| 2011 | 49,642 | -0.1% |
| 2010 | 49,710 | - |
Race / Ethnicity in Cuyahoga Falls
See the full breakdown
Cuyahoga Falls is:
84.1% White with 42,807 White residents.
4.8% African American with 2,463 African American residents.
0.0% American Indian with 4 American Indian residents.
4.6% Asian with 2,333 Asian residents.
0.0% Hawaiian with 0 Hawaiian residents.
0.6% Other with 293 Other residents.
3.5% Two Or More with 1,777 Two Or More residents.
2.4% Hispanic with 1,232 Hispanic residents.
| Race | Cuyahoga Falls | OH | USA |
|---|---|---|---|
| White | 84.1% | 75.8% | 57.4% |
| African American | 4.8% | 12.0% | 11.9% |
| American Indian | 0.0% | 0.1% | 0.5% |
| Asian | 4.6% | 2.5% | 5.9% |
| Hawaiian | 0.0% | 0.0% | 0.2% |
| Other | 0.6% | 0.4% | 0.6% |
| Two Or More | 3.5% | 4.3% | 4.3% |
| Hispanic | 2.4% | 4.8% | 19.3% |
Gender in Cuyahoga Falls
See the full breakdown
Cuyahoga Falls is 52.1% female with 26,499 female residents.
Cuyahoga Falls is 47.9% male with 24,410 male residents.
| Gender | Cuyahoga Falls | OH | USA |
|---|---|---|---|
| Female | 52.1% | 50.7% | 50.5% |
| Male | 47.9% | 49.3% | 49.5% |
Highest level of educational attainment in Cuyahoga Falls for adults over 25
See the full breakdown
2.0% of adults in Cuyahoga Falls completed < 9th grade.
3.0% of adults in Cuyahoga Falls completed 9-12th grade.
28.0% of adults in Cuyahoga Falls completed high school / ged.
20.0% of adults in Cuyahoga Falls completed some college.
9.0% of adults in Cuyahoga Falls completed associate's degree.
25.0% of adults in Cuyahoga Falls completed bachelor's degree.
10.0% of adults in Cuyahoga Falls completed master's degree.
2.0% of adults in Cuyahoga Falls completed professional degree.
1.0% of adults in Cuyahoga Falls completed doctorate degree.
| Education | Cuyahoga Falls | OH | USA |
|---|---|---|---|
| < 9th Grade | 2.0% | 3.0% | 4.0% |
| 9-12th Grade | 3.0% | 6.0% | 6.0% |
| High School / GED | 28.0% | 32.0% | 26.0% |
| Some College | 20.0% | 19.0% | 19.0% |
| Associate's Degree | 9.0% | 9.0% | 9.0% |
| Bachelor's Degree | 25.0% | 19.0% | 22.0% |
| Master's Degree | 10.0% | 9.0% | 10.0% |
| Professional Degree | 2.0% | 2.0% | 2.0% |
| Doctorate Degree | 1.0% | 1.0% | 2.0% |
Household Income For Cuyahoga Falls, Ohio
See the full breakdown
4.3% of households in Cuyahoga Falls earn Less than $10,000.
2.4% of households in Cuyahoga Falls earn $10,000 to $14,999.
7.2% of households in Cuyahoga Falls earn $15,000 to $24,999.
7.1% of households in Cuyahoga Falls earn $25,000 to $34,999.
11.8% of households in Cuyahoga Falls earn $35,000 to $49,999.
18.7% of households in Cuyahoga Falls earn $50,000 to $74,999.
15.3% of households in Cuyahoga Falls earn $75,000 to $99,999.
18.8% of households in Cuyahoga Falls earn $100,000 to $149,999.
8.3% of households in Cuyahoga Falls earn $150,000 to $199,999.
6.2% of households in Cuyahoga Falls earn $200,000 or more.
| Income | Cuyahoga Falls | OH | USA |
|---|---|---|---|
| Less than $10,000 | 4.3% | 5.2% | 5.0% |
| $10,000 to $14,999 | 2.4% | 4.0% | 3.4% |
| $15,000 to $24,999 | 7.2% | 7.1% | 6.3% |
| $25,000 to $34,999 | 7.1% | 7.5% | 6.6% |
| $35,000 to $49,999 | 11.8% | 11.6% | 10.1% |
| $50,000 to $74,999 | 18.7% | 16.9% | 15.5% |
| $75,000 to $99,999 | 15.3% | 13.1% | 12.6% |
| $100,000 to $149,999 | 18.8% | 17.1% | 17.5% |
| $150,000 to $199,999 | 8.3% | 8.3% | 9.6% |
| $200,000 or more | 6.2% | 9.1% | 13.4% |
Source: U.S. Census ACS 5-year estimates (2024)


