Elyria SnackAbility
Overall SnackAbility
Crime in Elyria summary. We use data from the FBI to determine the crime rates in Elyria. Key points include:
There were 943 total crimes in Elyria in the last reporting year.
The overall crime rate per 100,000 people in Elyria is 1,770.5 / 100k people.
The violent crime rate per 100,000 people in Elyria is 291.0 / 100k people.
The property crime rate per 100,000 people in Elyria is 1,479.5 / 100k people.
Overall, crime in Elyria is -16.46% below the national average.
Total Crimes
Below National Average
Crime In Elyria Comparison Table
| Statistic | Count Raw |
Elyria / 100k People |
Ohio / 100k People |
National / 100k People |
|---|---|---|---|---|
| Total Crimes Per 100K | 943 | 1,770.5 | 1,844.9 | 2,119.2 |
| Violent Crime | 155 | 291.0 | 293.7 | 359.0 |
| Murder | 2 | 3.8 | 5.0 | 5.0 |
| Robbery | 15 | 28.2 | 45.5 | 61.0 |
| Aggravated Assault | 113 | 212.2 | 197.4 | 256.0 |
| Property Crime | 788 | 1,479.5 | 1,551.2 | 1,760.0 |
| Burglary | 112 | 210.3 | 206.0 | 229.0 |
| Larceny | 633 | 1,188.4 | 1,132.8 | 1,272.0 |
| Car Theft | 43 | 80.7 | 212.5 | 259.0 |
Source: FBI Uniform Crime Reporting (2024)
Cost of living in Elyria summary. We use data on the cost of living to determine how expensive it is to live in Elyria. Real estate prices drive most of the variance in cost of living around Ohio. Key points include:
The cost of living in Elyria is 87 with 100 being average.
The cost of living in Elyria is 0.9x lower than the national average.
The median home value in Elyria is $181,556.
The median income in Elyria is $54,945.
Elyria's Overall Cost Of Living
Lower Than The National Average
Cost Of Living In Elyria Comparison Table
| Living Expense | Elyria | Ohio | National Average |
|---|---|---|---|
| Overall | 87 | 90 | 100 |
| Services | 97 | 97 | 100 |
| Groceries | 99 | 97 | 100 |
| Health | 67 | 75 | 100 |
| Housing | 93 | 97 | 100 |
| Transportation | 92 | 95 | 100 |
| Utilities | 94 | 97 | 100 |
Source: Cost of living index, normalized to US average = 100
Elyria, OH Weather
The average high in Elyria is 60.0° and the average low is 41.9°.
There are 87.8 days of precipitation each year.
Expect an average of 38.5 inches of precipitation each year with 46.9 inches of snow.
| Stat | Elyria |
|---|---|
| Average Annual High | 60.0 |
| Average Annual Low | 41.9 |
| Annual Precipitation Days | 87.8 |
| Average Annual Precipitation | 38.5 |
| Average Annual Snowfall | 46.9 |
Average High
Days of Rain
Source: NOAA climate normals (30-year)
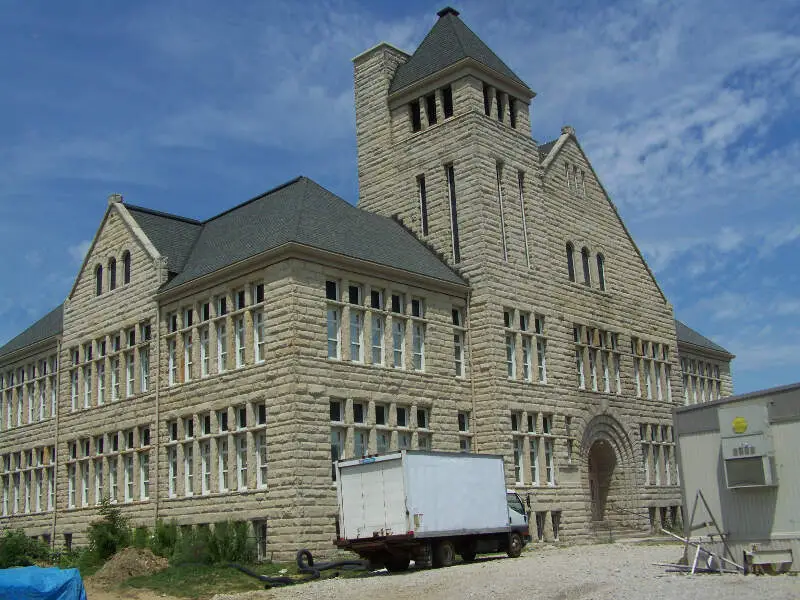
Elyria, OH Photos


Rankings & Articles For Elyria


Locations Around Elyria
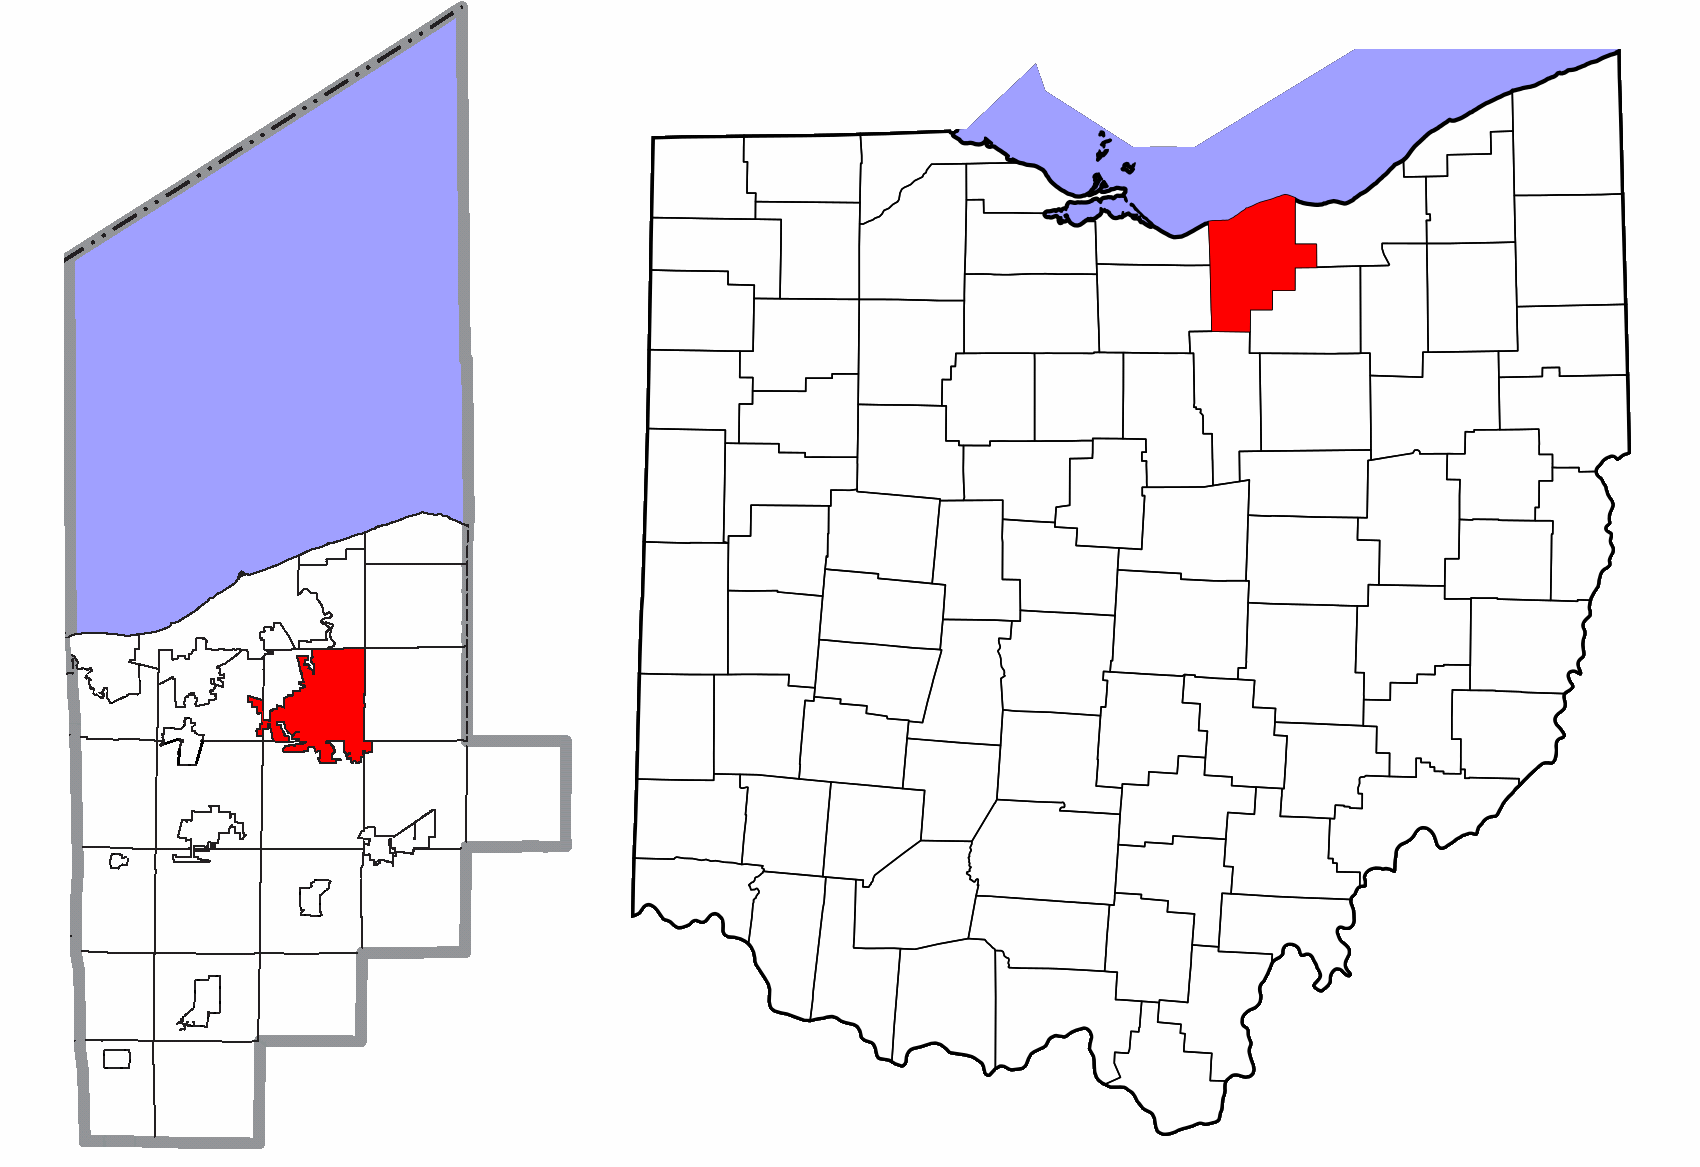
Map Of Elyria, OH
Best Places Around Elyria
Westlake, OH
Population 34,104
North Olmsted, OH
Population 31,924
Strongsville, OH
Population 45,983
Rocky River, OH
Population 21,490
North Ridgeville, OH
Population 36,627
Avon Lake, OH
Population 25,752
North Royalton, OH
Population 30,972
Olmsted Falls, OH
Population 8,639
Fairview Park, OH
Population 17,018
Lakewood, OH
Population 50,007
Elyria Demographics And Statistics
Population over time in Elyria
The current population in Elyria is 53,035. The population has decreased 3.6% from 2010.
| Year | Population | % Change |
|---|---|---|
| 2024 | 53,035 | 0.4% |
| 2023 | 52,833 | 0.1% |
| 2022 | 52,780 | -0.1% |
| 2021 | 52,853 | -1.8% |
| 2020 | 53,844 | 0.0% |
| 2019 | 53,821 | -0.2% |
| 2018 | 53,910 | -0.1% |
| 2017 | 53,944 | 0.0% |
| 2016 | 53,928 | -0.2% |
| 2015 | 54,050 | -0.3% |
| 2014 | 54,216 | -0.1% |
| 2013 | 54,290 | -0.4% |
| 2012 | 54,535 | -0.6% |
| 2011 | 54,844 | -0.3% |
| 2010 | 55,003 | - |
Race / Ethnicity in Elyria
See the full breakdown
Elyria is:
67.8% White with 35,979 White residents.
12.2% African American with 6,451 African American residents.
0.1% American Indian with 50 American Indian residents.
1.4% Asian with 719 Asian residents.
0.0% Hawaiian with 0 Hawaiian residents.
0.4% Other with 231 Other residents.
7.6% Two Or More with 4,048 Two Or More residents.
10.5% Hispanic with 5,557 Hispanic residents.
| Race | Elyria | OH | USA |
|---|---|---|---|
| White | 67.8% | 75.8% | 57.4% |
| African American | 12.2% | 12.0% | 11.9% |
| American Indian | 0.1% | 0.1% | 0.5% |
| Asian | 1.4% | 2.5% | 5.9% |
| Hawaiian | 0.0% | 0.0% | 0.2% |
| Other | 0.4% | 0.4% | 0.6% |
| Two Or More | 7.6% | 4.3% | 4.3% |
| Hispanic | 10.5% | 4.8% | 19.3% |
Gender in Elyria
See the full breakdown
Elyria is 51.7% female with 27,427 female residents.
Elyria is 48.3% male with 25,608 male residents.
| Gender | Elyria | OH | USA |
|---|---|---|---|
| Female | 51.7% | 50.7% | 50.5% |
| Male | 48.3% | 49.3% | 49.5% |
Highest level of educational attainment in Elyria for adults over 25
See the full breakdown
2.0% of adults in Elyria completed < 9th grade.
10.0% of adults in Elyria completed 9-12th grade.
34.0% of adults in Elyria completed high school / ged.
24.0% of adults in Elyria completed some college.
12.0% of adults in Elyria completed associate's degree.
12.0% of adults in Elyria completed bachelor's degree.
5.0% of adults in Elyria completed master's degree.
1.0% of adults in Elyria completed professional degree.
0.0% of adults in Elyria completed doctorate degree.
| Education | Elyria | OH | USA |
|---|---|---|---|
| < 9th Grade | 2.0% | 3.0% | 4.0% |
| 9-12th Grade | 10.0% | 6.0% | 6.0% |
| High School / GED | 34.0% | 32.0% | 26.0% |
| Some College | 24.0% | 19.0% | 19.0% |
| Associate's Degree | 12.0% | 9.0% | 9.0% |
| Bachelor's Degree | 12.0% | 19.0% | 22.0% |
| Master's Degree | 5.0% | 9.0% | 10.0% |
| Professional Degree | 1.0% | 2.0% | 2.0% |
| Doctorate Degree | 0.0% | 1.0% | 2.0% |
Household Income For Elyria, Ohio
See the full breakdown
7.7% of households in Elyria earn Less than $10,000.
4.8% of households in Elyria earn $10,000 to $14,999.
8.0% of households in Elyria earn $15,000 to $24,999.
9.1% of households in Elyria earn $25,000 to $34,999.
16.2% of households in Elyria earn $35,000 to $49,999.
18.5% of households in Elyria earn $50,000 to $74,999.
14.0% of households in Elyria earn $75,000 to $99,999.
12.2% of households in Elyria earn $100,000 to $149,999.
5.5% of households in Elyria earn $150,000 to $199,999.
4.0% of households in Elyria earn $200,000 or more.
| Income | Elyria | OH | USA |
|---|---|---|---|
| Less than $10,000 | 7.7% | 5.2% | 5.0% |
| $10,000 to $14,999 | 4.8% | 4.0% | 3.4% |
| $15,000 to $24,999 | 8.0% | 7.1% | 6.3% |
| $25,000 to $34,999 | 9.1% | 7.5% | 6.6% |
| $35,000 to $49,999 | 16.2% | 11.6% | 10.1% |
| $50,000 to $74,999 | 18.5% | 16.9% | 15.5% |
| $75,000 to $99,999 | 14.0% | 13.1% | 12.6% |
| $100,000 to $149,999 | 12.2% | 17.1% | 17.5% |
| $150,000 to $199,999 | 5.5% | 8.3% | 9.6% |
| $200,000 or more | 4.0% | 9.1% | 13.4% |
Source: U.S. Census ACS 5-year estimates (2024)


