Lorain SnackAbility
Overall SnackAbility
Crime in Lorain summary. We use data from the FBI to determine the crime rates in Lorain. Key points include:
There were 1,394 total crimes in Lorain in the last reporting year.
The overall crime rate per 100,000 people in Lorain is 2,132.3 / 100k people.
The violent crime rate per 100,000 people in Lorain is 581.3 / 100k people.
The property crime rate per 100,000 people in Lorain is 1,551.1 / 100k people.
Overall, crime in Lorain is 0.62% above the national average.
Total Crimes
Above National Average
Crime In Lorain Comparison Table
| Statistic | Count Raw |
Lorain / 100k People |
Ohio / 100k People |
National / 100k People |
|---|---|---|---|---|
| Total Crimes Per 100K | 1,394 | 2,132.3 | 1,844.9 | 2,119.2 |
| Violent Crime | 380 | 581.3 | 293.7 | 359.0 |
| Murder | 2 | 3.1 | 5.0 | 5.0 |
| Robbery | 35 | 53.5 | 45.5 | 61.0 |
| Aggravated Assault | 323 | 494.1 | 197.4 | 256.0 |
| Property Crime | 1,014 | 1,551.1 | 1,551.2 | 1,760.0 |
| Burglary | 169 | 258.5 | 206.0 | 229.0 |
| Larceny | 753 | 1,151.8 | 1,132.8 | 1,272.0 |
| Car Theft | 92 | 140.7 | 212.5 | 259.0 |
Source: FBI Uniform Crime Reporting (2024)
Cost of living in Lorain summary. We use data on the cost of living to determine how expensive it is to live in Lorain. Real estate prices drive most of the variance in cost of living around Ohio. Key points include:
The cost of living in Lorain is 82 with 100 being average.
The cost of living in Lorain is 0.8x lower than the national average.
The median home value in Lorain is $150,828.
The median income in Lorain is $48,685.
Lorain's Overall Cost Of Living
Lower Than The National Average
Cost Of Living In Lorain Comparison Table
| Living Expense | Lorain | Ohio | National Average |
|---|---|---|---|
| Overall | 82 | 90 | 100 |
| Services | 96 | 97 | 100 |
| Groceries | 92 | 97 | 100 |
| Health | 57 | 75 | 100 |
| Housing | 96 | 97 | 100 |
| Transportation | 94 | 95 | 100 |
| Utilities | 96 | 97 | 100 |
Source: Cost of living index, normalized to US average = 100
Lorain, OH Weather
The average high in Lorain is 58.7° and the average low is 43.2°.
There are 84.1 days of precipitation each year.
Expect an average of 37.3 inches of precipitation each year with 48.5 inches of snow.
| Stat | Lorain |
|---|---|
| Average Annual High | 58.7 |
| Average Annual Low | 43.2 |
| Annual Precipitation Days | 84.1 |
| Average Annual Precipitation | 37.3 |
| Average Annual Snowfall | 48.5 |
Average High
Days of Rain
Source: NOAA climate normals (30-year)
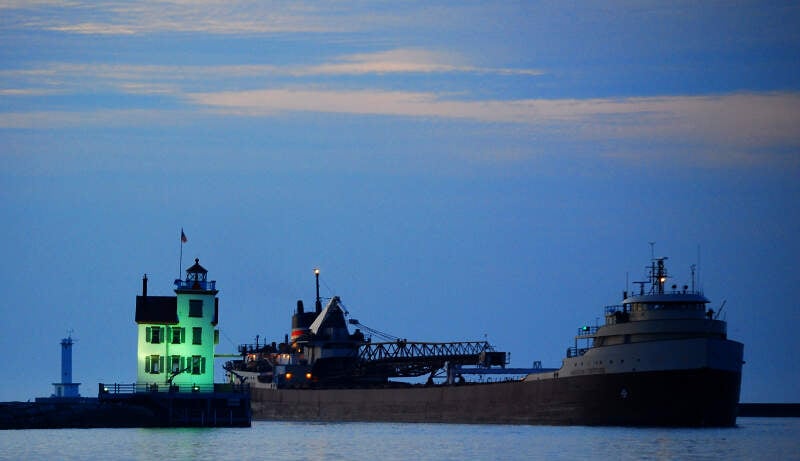
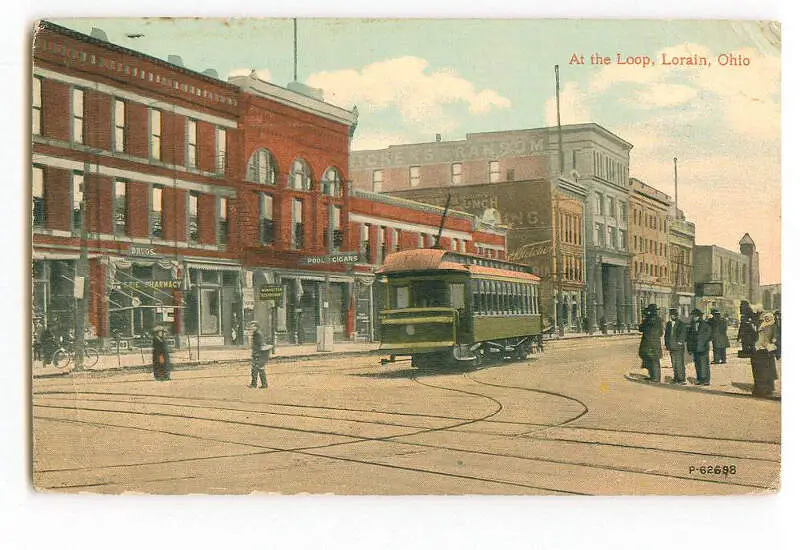
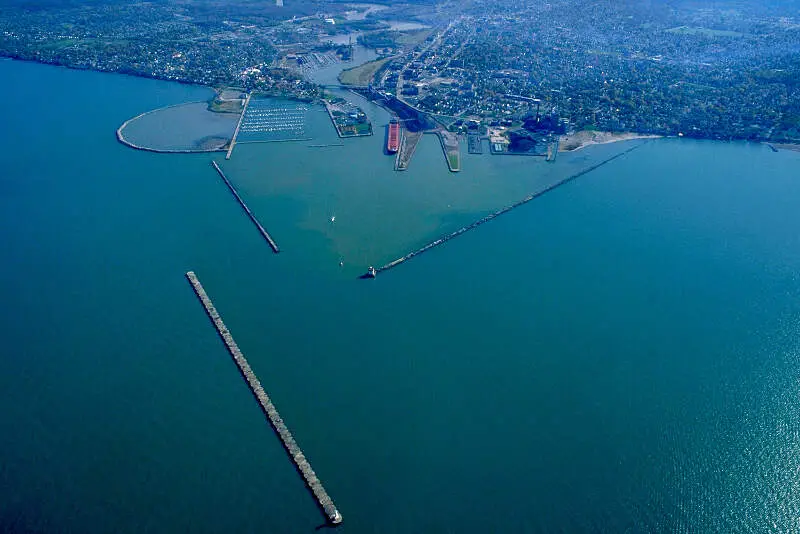
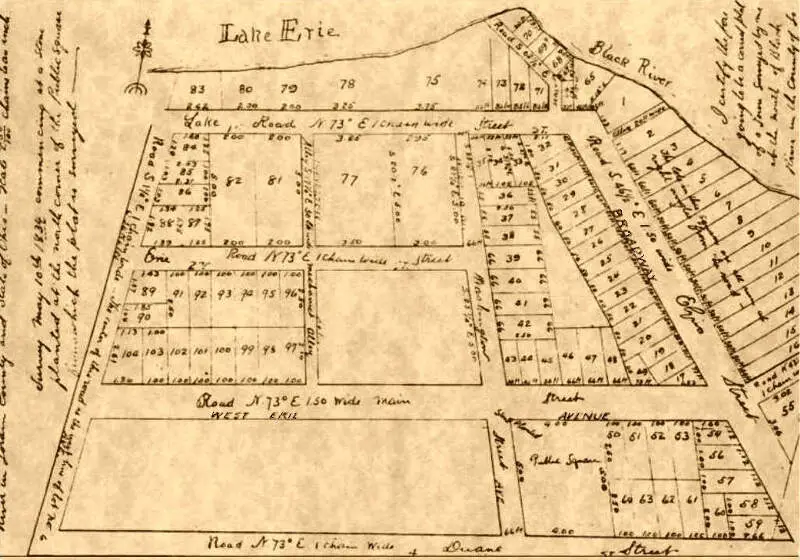
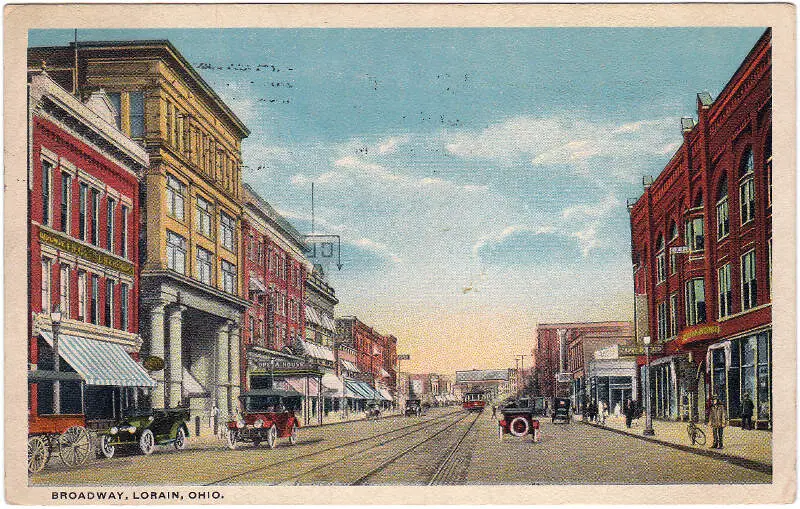
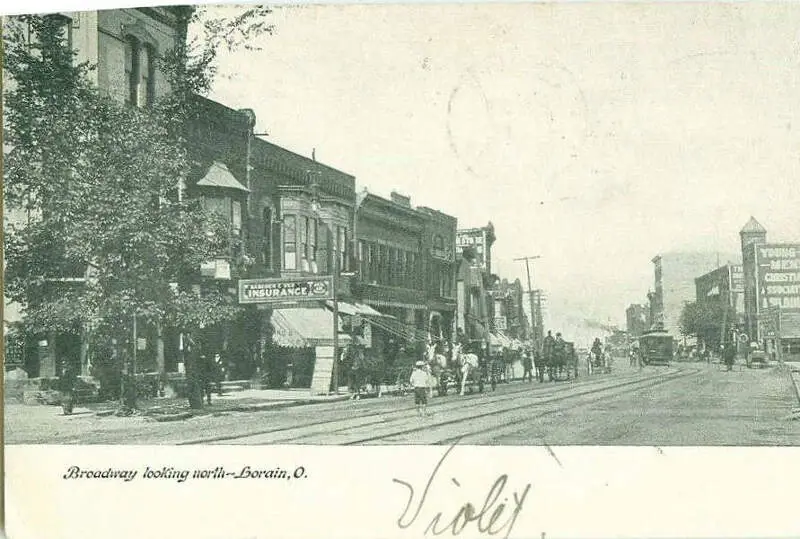
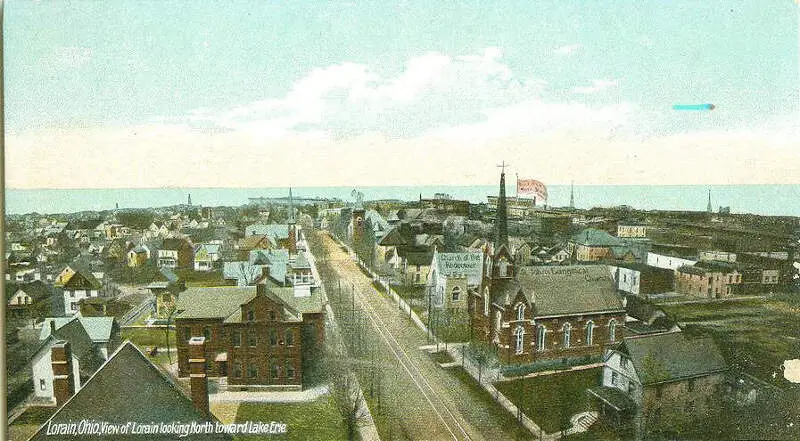
Lorain, OH Photos
1 Reviews & Comments About Lorain

I loved growing up in Lorain, OH. The city is between Cleveland and Sandusky and is so culturally diverse. My mom was born overseas and Polish was her first language and when they moved to this predominately Hispanic town it changed a lot of the way her younger siblings were raised. When she met my dad who was Italian and had my sister and I, they continued to show us the best things about each nationality in the area. Lorain still has yearly International festivals full of Puerto Rican, Polish, Italian, Greek, Southern and Slovak foods and the parades are beautiful. When I moved to my current city, I was shocked over the lack of diversity and the horrible racism and comments that people make.
The best thing was the diversity. But, there is also bad. This is a city that a steel mill and car factory shut down and crush the town. When most of your population is employed by factories and they shut down, crime rises. Drug issues are prevalent as is gang activity.
Rankings & Articles For Lorain


Locations Around Lorain
Map Of Lorain, OH
Best Places Around Lorain
Westlake, OH
Population 34,104
North Olmsted, OH
Population 31,924
Rocky River, OH
Population 21,490
North Ridgeville, OH
Population 36,627
Avon Lake, OH
Population 25,752
Olmsted Falls, OH
Population 8,639
Fairview Park, OH
Population 17,018
Lakewood, OH
Population 50,007
Middleburg Heights, OH
Population 15,786
Avon, OH
Population 25,317
Lorain Demographics And Statistics
Population over time in Lorain
The current population in Lorain is 65,395. The population has increased 0.3% from 2010.
| Year | Population | % Change |
|---|---|---|
| 2024 | 65,395 | 0.3% |
| 2023 | 65,207 | 0.1% |
| 2022 | 65,138 | 0.1% |
| 2021 | 65,051 | 1.9% |
| 2020 | 63,832 | 0.0% |
| 2019 | 63,801 | 0.0% |
| 2018 | 63,773 | 0.1% |
| 2017 | 63,731 | 0.0% |
| 2016 | 63,714 | -0.1% |
| 2015 | 63,778 | -0.2% |
| 2014 | 63,885 | -0.2% |
| 2013 | 64,017 | -0.5% |
| 2012 | 64,313 | -0.8% |
| 2011 | 64,810 | -0.6% |
| 2010 | 65,221 | - |
Race / Ethnicity in Lorain
See the full breakdown
Lorain is:
49.1% White with 32,103 White residents.
16.5% African American with 10,799 African American residents.
0.1% American Indian with 75 American Indian residents.
0.4% Asian with 244 Asian residents.
0.0% Hawaiian with 0 Hawaiian residents.
0.4% Other with 291 Other residents.
5.1% Two Or More with 3,363 Two Or More residents.
28.3% Hispanic with 18,520 Hispanic residents.
| Race | Lorain | OH | USA |
|---|---|---|---|
| White | 49.1% | 75.8% | 57.4% |
| African American | 16.5% | 12.0% | 11.9% |
| American Indian | 0.1% | 0.1% | 0.5% |
| Asian | 0.4% | 2.5% | 5.9% |
| Hawaiian | 0.0% | 0.0% | 0.2% |
| Other | 0.4% | 0.4% | 0.6% |
| Two Or More | 5.1% | 4.3% | 4.3% |
| Hispanic | 28.3% | 4.8% | 19.3% |
Gender in Lorain
See the full breakdown
Lorain is 51.4% female with 33,626 female residents.
Lorain is 48.6% male with 31,769 male residents.
| Gender | Lorain | OH | USA |
|---|---|---|---|
| Female | 51.4% | 50.7% | 50.5% |
| Male | 48.6% | 49.3% | 49.5% |
Highest level of educational attainment in Lorain for adults over 25
See the full breakdown
6.0% of adults in Lorain completed < 9th grade.
10.0% of adults in Lorain completed 9-12th grade.
37.0% of adults in Lorain completed high school / ged.
24.0% of adults in Lorain completed some college.
9.0% of adults in Lorain completed associate's degree.
10.0% of adults in Lorain completed bachelor's degree.
3.0% of adults in Lorain completed master's degree.
0.0% of adults in Lorain completed professional degree.
1.0% of adults in Lorain completed doctorate degree.
| Education | Lorain | OH | USA |
|---|---|---|---|
| < 9th Grade | 6.0% | 3.0% | 4.0% |
| 9-12th Grade | 10.0% | 6.0% | 6.0% |
| High School / GED | 37.0% | 32.0% | 26.0% |
| Some College | 24.0% | 19.0% | 19.0% |
| Associate's Degree | 9.0% | 9.0% | 9.0% |
| Bachelor's Degree | 10.0% | 19.0% | 22.0% |
| Master's Degree | 3.0% | 9.0% | 10.0% |
| Professional Degree | 0.0% | 2.0% | 2.0% |
| Doctorate Degree | 1.0% | 1.0% | 2.0% |
Household Income For Lorain, Ohio
See the full breakdown
9.6% of households in Lorain earn Less than $10,000.
9.1% of households in Lorain earn $10,000 to $14,999.
10.0% of households in Lorain earn $15,000 to $24,999.
9.2% of households in Lorain earn $25,000 to $34,999.
13.0% of households in Lorain earn $35,000 to $49,999.
18.3% of households in Lorain earn $50,000 to $74,999.
11.0% of households in Lorain earn $75,000 to $99,999.
11.4% of households in Lorain earn $100,000 to $149,999.
6.2% of households in Lorain earn $150,000 to $199,999.
2.2% of households in Lorain earn $200,000 or more.
| Income | Lorain | OH | USA |
|---|---|---|---|
| Less than $10,000 | 9.6% | 5.2% | 5.0% |
| $10,000 to $14,999 | 9.1% | 4.0% | 3.4% |
| $15,000 to $24,999 | 10.0% | 7.1% | 6.3% |
| $25,000 to $34,999 | 9.2% | 7.5% | 6.6% |
| $35,000 to $49,999 | 13.0% | 11.6% | 10.1% |
| $50,000 to $74,999 | 18.3% | 16.9% | 15.5% |
| $75,000 to $99,999 | 11.0% | 13.1% | 12.6% |
| $100,000 to $149,999 | 11.4% | 17.1% | 17.5% |
| $150,000 to $199,999 | 6.2% | 8.3% | 9.6% |
| $200,000 or more | 2.2% | 9.1% | 13.4% |
Source: U.S. Census ACS 5-year estimates (2024)


