Marysville, OH
Demographics And Statistics
Living In Marysville, Ohio Summary
Life in Marysville research summary. HomeSnacks has been using Saturday Night Science to research the quality of life in Marysville over the past nine years using Census, FBI, Zillow, and other primary data sources. Based on the most recently available data, we found the following about life in Marysville:
The population in Marysville is 26,540.
The median home value in Marysville is $365,251.
The median income in Marysville is $92,490.
The cost of living in Marysville is 99 which is 1.0x lower than the national average.
The median rent in Marysville is $1,179.
The unemployment rate in Marysville is 2.9%.
The poverty rate in Marysville is 7.3%.
The average high in Marysville is 61.6° and the average low is 41.5°.
Marysville SnackAbility
Overall SnackAbility
Marysville, OH Crime Report
Crime in Marysville summary. We use data from the FBI to determine the crime rates in Marysville. Key points include:
There were 347 total crimes in Marysville in the last reporting year.
The overall crime rate per 100,000 people in Marysville is 1,180.6 / 100k people.
The violent crime rate per 100,000 people in Marysville is 98.7 / 100k people.
The property crime rate per 100,000 people in Marysville is 1,081.9 / 100k people.
Overall, crime in Marysville is -44.29% below the national average.
Total Crimes
Below National Average
Crime In Marysville Comparison Table
| Statistic | Count Raw |
Marysville / 100k People |
Ohio / 100k People |
National / 100k People |
|---|---|---|---|---|
| Total Crimes Per 100K | 347 | 1,180.6 | 1,844.9 | 2,119.2 |
| Violent Crime | 29 | 98.7 | 293.7 | 359.0 |
| Murder | 0 | 0.0 | 5.0 | 5.0 |
| Robbery | 2 | 6.8 | 45.5 | 61.0 |
| Aggravated Assault | 14 | 47.6 | 197.4 | 256.0 |
| Property Crime | 318 | 1,081.9 | 1,551.2 | 1,760.0 |
| Burglary | 15 | 51.0 | 206.0 | 229.0 |
| Larceny | 292 | 993.4 | 1,132.8 | 1,272.0 |
| Car Theft | 11 | 37.4 | 212.5 | 259.0 |
Marysville, OH Cost Of Living
Cost of living in Marysville summary. We use data on the cost of living to determine how expensive it is to live in Marysville. Real estate prices drive most of the variance in cost of living around Ohio. Key points include:
The cost of living in Marysville is 99 with 100 being average.
The cost of living in Marysville is 1.0x lower than the national average.
The median home value in Marysville is $365,251.
The median income in Marysville is $92,490.
Marysville's Overall Cost Of Living
Lower Than The National Average
Cost Of Living In Marysville Comparison Table
| Living Expense | Marysville | Ohio | National Average | |
|---|---|---|---|---|
| Overall | 99 | 93 | 100 | |
| Services | 92 | 101 | 100 | |
| Groceries | 105 | 103 | 100 | |
| Health | 84 | 97 | 100 | |
| Housing | 112 | 74 | 100 | |
| Transportation | 88 | 102 | 100 | |
| Utilities | 96 | 100 | 100 | |
Marysville, OH Weather
The average high in Marysville is 61.6° and the average low is 41.5°.
There are 80.3 days of precipitation each year.
Expect an average of 38.3 inches of precipitation each year with 22.6 inches of snow.
| Stat | Marysville |
|---|---|
| Average Annual High | 61.6 |
| Average Annual Low | 41.5 |
| Annual Precipitation Days | 80.3 |
| Average Annual Precipitation | 38.3 |
| Average Annual Snowfall | 22.6 |
Average High
Days of Rain
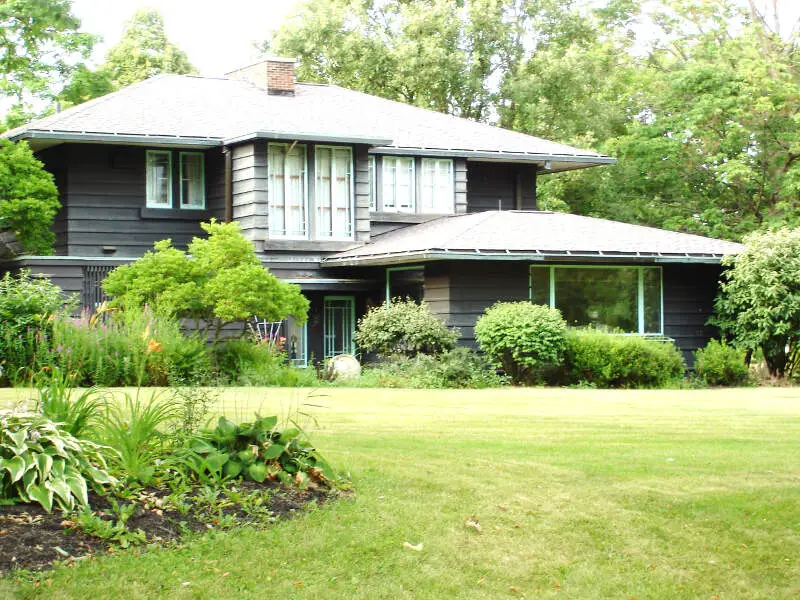
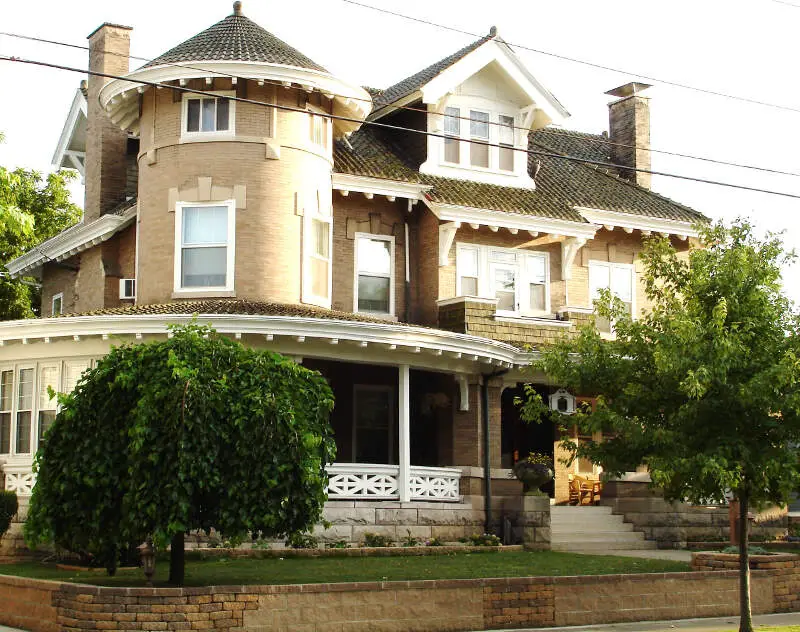
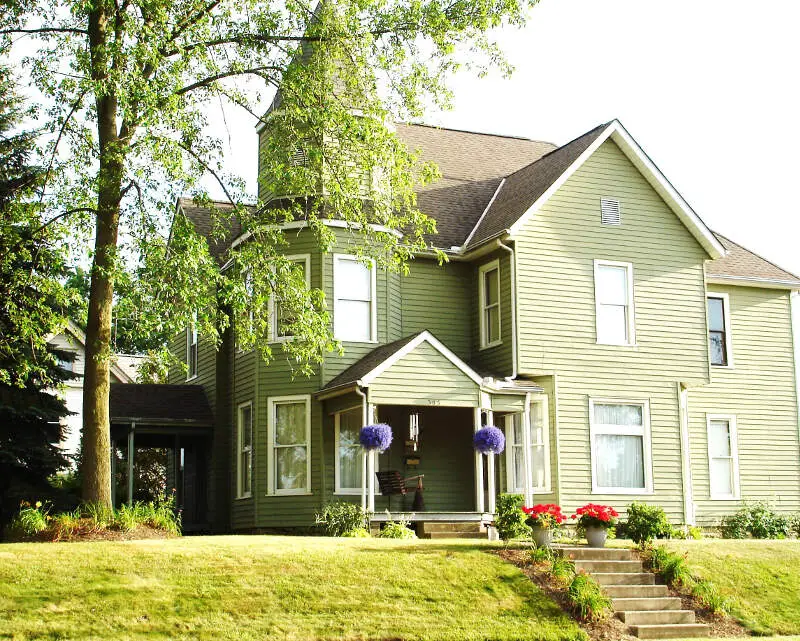
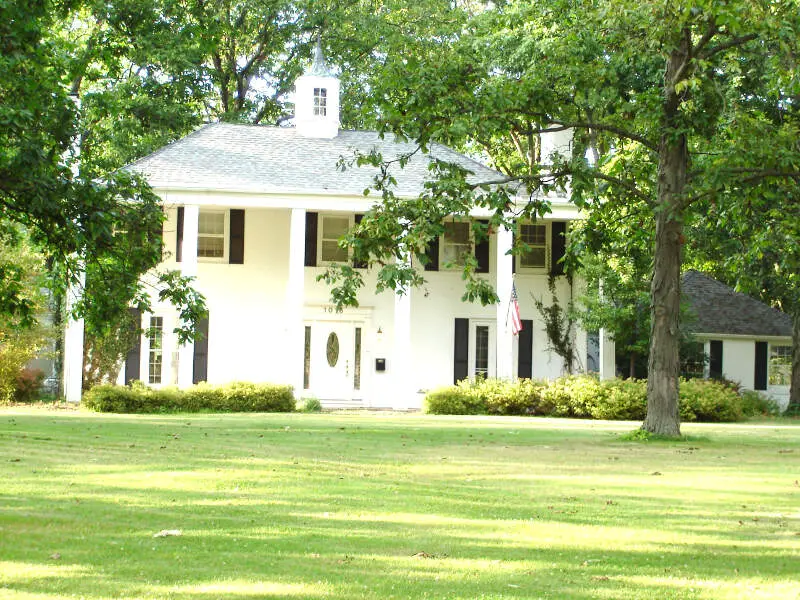
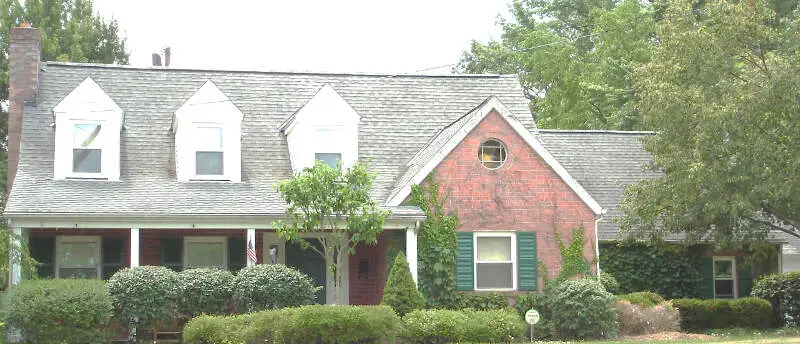
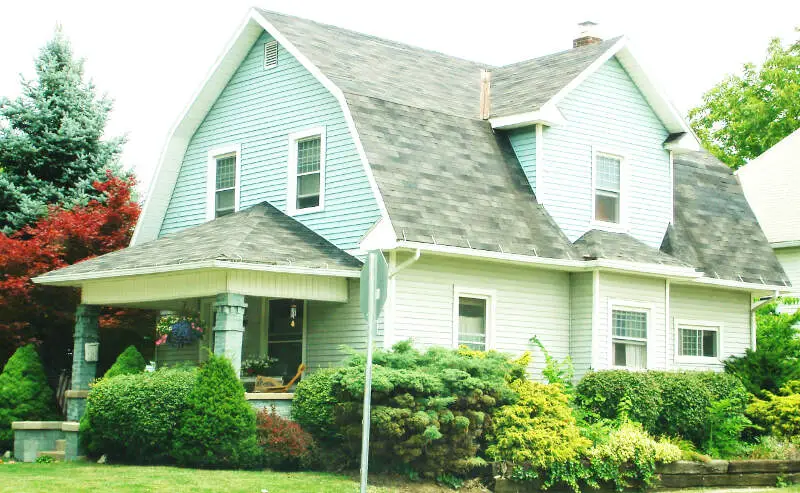
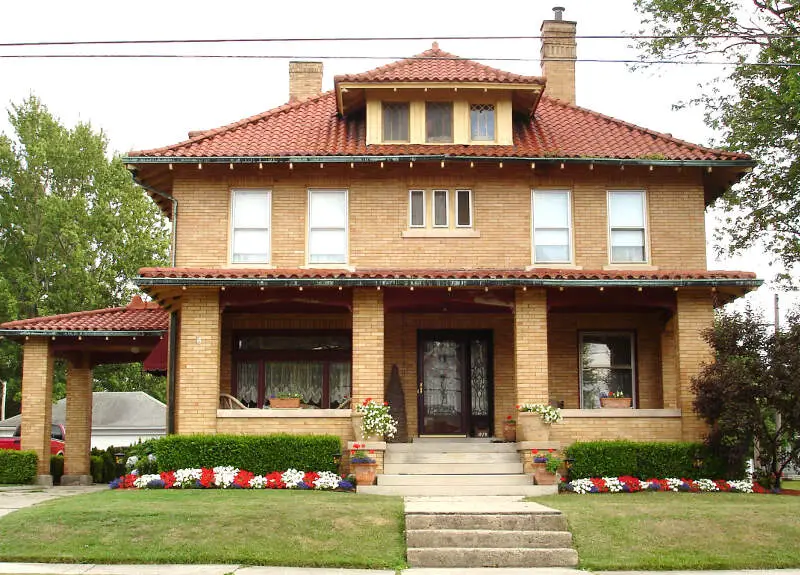
Marysville, OH Photos


Rankings for Marysville in Ohio


Locations Around Marysville
Map Of Marysville, OH
Best Places Around Marysville
Upper Arlington, OH
Population 36,319
Powell, OH
Population 14,229
Bexley, OH
Population 13,324
Gahanna, OH
Population 35,438
Grandview Heights, OH
Population 8,422
Dublin, OH
Population 49,031
Hilliard, OH
Population 36,560
New Albany, OH
Population 10,524
Westerville, OH
Population 38,543
Worthington, OH
Population 14,754
Marysville Demographics And Statistics
Population over time in Marysville
The current population in Marysville is 26,540. The population has increased 24.6% from 2010.
| Year | Population | % Change |
|---|---|---|
| 2023 | 26,540 | 2.8% |
| 2022 | 25,806 | 3.5% |
| 2021 | 24,922 | 1.4% |
| 2020 | 24,569 | 3.2% |
| 2019 | 23,808 | 1.3% |
| 2018 | 23,509 | 2.6% |
| 2017 | 22,924 | 0.3% |
| 2016 | 22,860 | 0.6% |
| 2015 | 22,732 | -0.2% |
| 2014 | 22,773 | 0.9% |
| 2013 | 22,581 | 0.3% |
| 2012 | 22,521 | 2.0% |
| 2011 | 22,089 | 3.7% |
| 2010 | 21,296 | - |
Race / Ethnicity in Marysville
Marysville is:
86.0% White with 22,816 White residents.
2.9% African American with 774 African American residents.
0.1% American Indian with 24 American Indian residents.
1.5% Asian with 394 Asian residents.
0.0% Hawaiian with 0 Hawaiian residents.
0.0% Other with 13 Other residents.
4.5% Two Or More with 1,182 Two Or More residents.
5.0% Hispanic with 1,337 Hispanic residents.
| Race | Marysville | OH | USA |
|---|---|---|---|
| White | 86.0% | 76.5% | 58.2% |
| African American | 2.9% | 12.1% | 12.0% |
| American Indian | 0.1% | 0.1% | 0.5% |
| Asian | 1.5% | 2.4% | 5.7% |
| Hawaiian | 0.0% | 0.0% | 0.2% |
| Other | 0.0% | 0.4% | 0.5% |
| Two Or More | 4.5% | 3.9% | 3.9% |
| Hispanic | 5.0% | 4.6% | 19.0% |
Gender in Marysville
Marysville is 55.0% female with 14,587 female residents.
Marysville is 45.0% male with 11,953 male residents.
| Gender | Marysville | OH | USA |
|---|---|---|---|
| Female | 55.0% | 50.7% | 50.5% |
| Male | 45.0% | 49.3% | 49.5% |
Highest level of educational attainment in Marysville for adults over 25
2.0% of adults in Marysville completed < 9th grade.
5.0% of adults in Marysville completed 9-12th grade.
31.0% of adults in Marysville completed high school / ged.
23.0% of adults in Marysville completed some college.
7.0% of adults in Marysville completed associate's degree.
24.0% of adults in Marysville completed bachelor's degree.
7.0% of adults in Marysville completed master's degree.
1.0% of adults in Marysville completed professional degree.
0.0% of adults in Marysville completed doctorate degree.
| Education | Marysville | OH | USA |
|---|---|---|---|
| < 9th Grade | 2.0% | 3.0% | 5.0% |
| 9-12th Grade | 5.0% | 6.0% | 6.0% |
| High School / GED | 31.0% | 32.0% | 26.0% |
| Some College | 23.0% | 19.0% | 19.0% |
| Associate's Degree | 7.0% | 9.0% | 9.0% |
| Bachelor's Degree | 24.0% | 19.0% | 21.0% |
| Master's Degree | 7.0% | 9.0% | 10.0% |
| Professional Degree | 1.0% | 2.0% | 2.0% |
| Doctorate Degree | 0.0% | 1.0% | 2.0% |
Household Income For Marysville, Ohio
2.4% of households in Marysville earn Less than $10,000.
1.0% of households in Marysville earn $10,000 to $14,999.
4.1% of households in Marysville earn $15,000 to $24,999.
3.4% of households in Marysville earn $25,000 to $34,999.
10.8% of households in Marysville earn $35,000 to $49,999.
16.6% of households in Marysville earn $50,000 to $74,999.
14.6% of households in Marysville earn $75,000 to $99,999.
25.9% of households in Marysville earn $100,000 to $149,999.
14.3% of households in Marysville earn $150,000 to $199,999.
6.8% of households in Marysville earn $200,000 or more.
| Income | Marysville | OH | USA |
|---|---|---|---|
| Less than $10,000 | 2.4% | 5.2% | 4.9% |
| $10,000 to $14,999 | 1.0% | 4.1% | 3.6% |
| $15,000 to $24,999 | 4.1% | 7.4% | 6.6% |
| $25,000 to $34,999 | 3.4% | 7.7% | 6.8% |
| $35,000 to $49,999 | 10.8% | 11.9% | 10.4% |
| $50,000 to $74,999 | 16.6% | 17.1% | 15.7% |
| $75,000 to $99,999 | 14.6% | 13.2% | 12.7% |
| $100,000 to $149,999 | 25.9% | 16.9% | 17.4% |
| $150,000 to $199,999 | 14.3% | 8.0% | 9.3% |
| $200,000 or more | 6.8% | 8.5% | 12.6% |


