New Philadelphia SnackAbility
Overall SnackAbility
Crime in New Philadelphia summary. We use data from the FBI to determine the crime rates in New Philadelphia. Key points include:
There were 109 total crimes in New Philadelphia in the last reporting year.
The overall crime rate per 100,000 people in New Philadelphia is 627.8 / 100k people.
The violent crime rate per 100,000 people in New Philadelphia is 115.2 / 100k people.
The property crime rate per 100,000 people in New Philadelphia is 512.6 / 100k people.
Overall, crime in New Philadelphia is -70.38% below the national average.
Total Crimes
Below National Average
Crime In New Philadelphia Comparison Table
| Statistic | Count Raw |
New Philadelphia / 100k People |
Ohio / 100k People |
National / 100k People |
|---|---|---|---|---|
| Total Crimes Per 100K | 109 | 627.8 | 1,844.9 | 2,119.2 |
| Violent Crime | 20 | 115.2 | 293.7 | 359.0 |
| Murder | 0 | 0.0 | 5.0 | 5.0 |
| Robbery | 1 | 5.8 | 45.5 | 61.0 |
| Aggravated Assault | 17 | 97.9 | 197.4 | 256.0 |
| Property Crime | 89 | 512.6 | 1,551.2 | 1,760.0 |
| Burglary | 11 | 63.4 | 206.0 | 229.0 |
| Larceny | 76 | 437.7 | 1,132.8 | 1,272.0 |
| Car Theft | 2 | 11.5 | 212.5 | 259.0 |
Source: FBI Uniform Crime Reporting (2024)
Cost of living in New Philadelphia summary. We use data on the cost of living to determine how expensive it is to live in New Philadelphia. Real estate prices drive most of the variance in cost of living around Ohio. Key points include:
The cost of living in New Philadelphia is 87 with 100 being average.
The cost of living in New Philadelphia is 0.9x lower than the national average.
The median home value in New Philadelphia is $204,370.
The median income in New Philadelphia is $58,547.
New Philadelphia's Overall Cost Of Living
Lower Than The National Average
Cost Of Living In New Philadelphia Comparison Table
| Living Expense | New Philadelphia | Ohio | National Average |
|---|---|---|---|
| Overall | 87 | 90 | 100 |
| Services | 96 | 97 | 100 |
| Groceries | 100 | 97 | 100 |
| Health | 71 | 75 | 100 |
| Housing | 99 | 97 | 100 |
| Transportation | 92 | 95 | 100 |
| Utilities | 95 | 97 | 100 |
Source: Cost of living index, normalized to US average = 100
New Philadelphia, OH Weather
The average high in New Philadelphia is 61.4° and the average low is 40.1°.
There are 84.7 days of precipitation each year.
Expect an average of 40.7 inches of precipitation each year with 26.3 inches of snow.
| Stat | New Philadelphia |
|---|---|
| Average Annual High | 61.4 |
| Average Annual Low | 40.1 |
| Annual Precipitation Days | 84.7 |
| Average Annual Precipitation | 40.7 |
| Average Annual Snowfall | 26.3 |
Average High
Days of Rain
Source: NOAA climate normals (30-year)
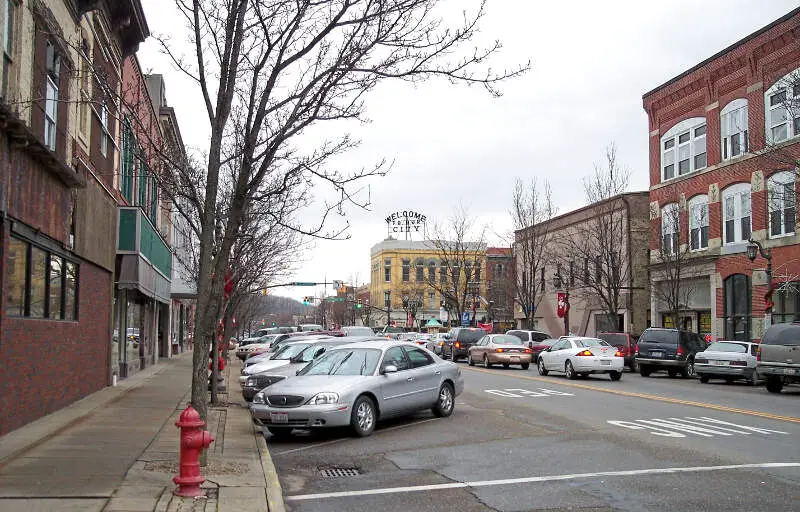
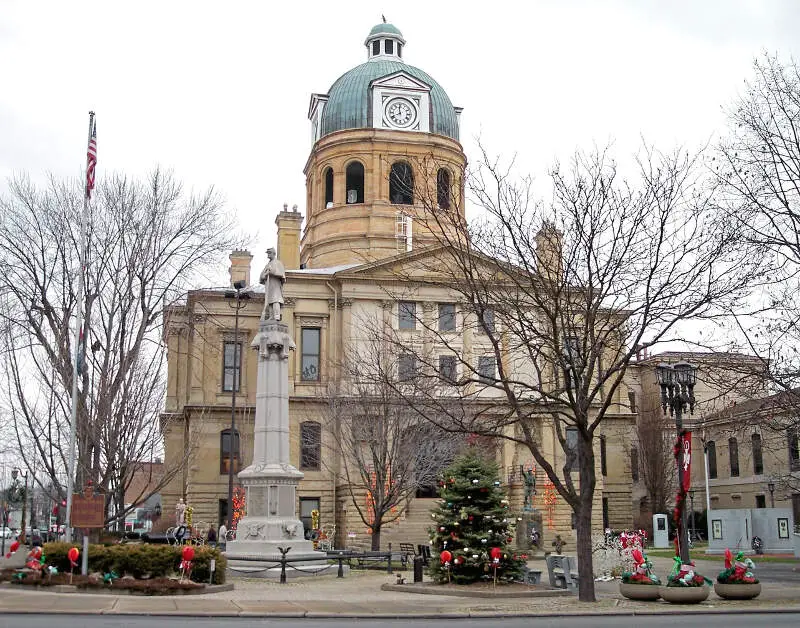
New Philadelphia, OH Photos
Rankings & Articles For New Philadelphia


Locations Around New Philadelphia
Map Of New Philadelphia, OH
Best Places Around New Philadelphia
Munroe Falls, OH
Population 5,000
Stow, OH
Population 34,240
Apple Valley, OH
Population 5,548
New Franklin, OH
Population 13,843
Green, OH
Population 27,393
Dover, OH
Population 13,053
Fairlawn, OH
Population 7,711
Kent, OH
Population 27,116
Wadsworth, OH
Population 24,492
North Canton, OH
Population 17,727
New Philadelphia Demographics And Statistics
Population over time in New Philadelphia
The current population in New Philadelphia is 17,520. The population has increased 1.3% from 2010.
| Year | Population | % Change |
|---|---|---|
| 2024 | 17,520 | -0.2% |
| 2023 | 17,563 | -0.2% |
| 2022 | 17,602 | -0.1% |
| 2021 | 17,622 | 0.8% |
| 2020 | 17,485 | 0.2% |
| 2019 | 17,446 | 0.1% |
| 2018 | 17,432 | 0.1% |
| 2017 | 17,408 | -0.0% |
| 2016 | 17,412 | 0.1% |
| 2015 | 17,397 | 0.4% |
| 2014 | 17,334 | 0.1% |
| 2013 | 17,321 | 0.3% |
| 2012 | 17,272 | -0.1% |
| 2011 | 17,285 | -0.0% |
| 2010 | 17,292 | - |
Race / Ethnicity in New Philadelphia
See the full breakdown
New Philadelphia is:
85.8% White with 15,037 White residents.
0.9% African American with 149 African American residents.
0.3% American Indian with 47 American Indian residents.
1.0% Asian with 167 Asian residents.
0.0% Hawaiian with 0 Hawaiian residents.
0.0% Other with 0 Other residents.
1.9% Two Or More with 333 Two Or More residents.
10.2% Hispanic with 1,787 Hispanic residents.
| Race | New Philadelphia | OH | USA |
|---|---|---|---|
| White | 85.8% | 75.8% | 57.4% |
| African American | 0.9% | 12.0% | 11.9% |
| American Indian | 0.3% | 0.1% | 0.5% |
| Asian | 1.0% | 2.5% | 5.9% |
| Hawaiian | 0.0% | 0.0% | 0.2% |
| Other | 0.0% | 0.4% | 0.6% |
| Two Or More | 1.9% | 4.3% | 4.3% |
| Hispanic | 10.2% | 4.8% | 19.3% |
Gender in New Philadelphia
See the full breakdown
New Philadelphia is 47.5% female with 8,323 female residents.
New Philadelphia is 52.5% male with 9,196 male residents.
| Gender | New Philadelphia | OH | USA |
|---|---|---|---|
| Female | 47.5% | 50.7% | 50.5% |
| Male | 52.5% | 49.3% | 49.5% |
Highest level of educational attainment in New Philadelphia for adults over 25
See the full breakdown
2.0% of adults in New Philadelphia completed < 9th grade.
6.0% of adults in New Philadelphia completed 9-12th grade.
39.0% of adults in New Philadelphia completed high school / ged.
19.0% of adults in New Philadelphia completed some college.
10.0% of adults in New Philadelphia completed associate's degree.
16.0% of adults in New Philadelphia completed bachelor's degree.
7.0% of adults in New Philadelphia completed master's degree.
1.0% of adults in New Philadelphia completed professional degree.
0.0% of adults in New Philadelphia completed doctorate degree.
| Education | New Philadelphia | OH | USA |
|---|---|---|---|
| < 9th Grade | 2.0% | 3.0% | 4.0% |
| 9-12th Grade | 6.0% | 6.0% | 6.0% |
| High School / GED | 39.0% | 32.0% | 26.0% |
| Some College | 19.0% | 19.0% | 19.0% |
| Associate's Degree | 10.0% | 9.0% | 9.0% |
| Bachelor's Degree | 16.0% | 19.0% | 22.0% |
| Master's Degree | 7.0% | 9.0% | 10.0% |
| Professional Degree | 1.0% | 2.0% | 2.0% |
| Doctorate Degree | 0.0% | 1.0% | 2.0% |
Household Income For New Philadelphia, Ohio
See the full breakdown
5.1% of households in New Philadelphia earn Less than $10,000.
6.0% of households in New Philadelphia earn $10,000 to $14,999.
6.8% of households in New Philadelphia earn $15,000 to $24,999.
11.3% of households in New Philadelphia earn $25,000 to $34,999.
12.9% of households in New Philadelphia earn $35,000 to $49,999.
18.7% of households in New Philadelphia earn $50,000 to $74,999.
15.7% of households in New Philadelphia earn $75,000 to $99,999.
14.3% of households in New Philadelphia earn $100,000 to $149,999.
5.2% of households in New Philadelphia earn $150,000 to $199,999.
4.1% of households in New Philadelphia earn $200,000 or more.
| Income | New Philadelphia | OH | USA |
|---|---|---|---|
| Less than $10,000 | 5.1% | 5.2% | 5.0% |
| $10,000 to $14,999 | 6.0% | 4.0% | 3.4% |
| $15,000 to $24,999 | 6.8% | 7.1% | 6.3% |
| $25,000 to $34,999 | 11.3% | 7.5% | 6.6% |
| $35,000 to $49,999 | 12.9% | 11.6% | 10.1% |
| $50,000 to $74,999 | 18.7% | 16.9% | 15.5% |
| $75,000 to $99,999 | 15.7% | 13.1% | 12.6% |
| $100,000 to $149,999 | 14.3% | 17.1% | 17.5% |
| $150,000 to $199,999 | 5.2% | 8.3% | 9.6% |
| $200,000 or more | 4.1% | 9.1% | 13.4% |
Source: U.S. Census ACS 5-year estimates (2024)


