Shaker Heights SnackAbility
Overall SnackAbility
Cost of living in Shaker Heights summary. We use data on the cost of living to determine how expensive it is to live in Shaker Heights. Real estate prices drive most of the variance in cost of living around Ohio. Key points include:
The cost of living in Shaker Heights is 103 with 100 being average.
The cost of living in Shaker Heights is 1.0x higher than the national average.
The median home value in Shaker Heights is $342,442.
The median income in Shaker Heights is $104,073.
Shaker Heights's Overall Cost Of Living
Higher Than The National Average
Cost Of Living In Shaker Heights Comparison Table
| Living Expense | Shaker Heights | Ohio | National Average |
|---|---|---|---|
| Overall | 103 | 90 | 100 |
| Services | 99 | 97 | 100 |
| Groceries | 99 | 97 | 100 |
| Health | 127 | 75 | 100 |
| Housing | 95 | 97 | 100 |
| Transportation | 95 | 95 | 100 |
| Utilities | 94 | 97 | 100 |
Source: Cost of living index, normalized to US average = 100
Shaker Heights, OH Weather
The average high in Shaker Heights is 58.9° and the average low is 40.8°.
There are 98.6 days of precipitation each year.
Expect an average of 42.9 inches of precipitation each year with 71.2 inches of snow.
| Stat | Shaker Heights |
|---|---|
| Average Annual High | 58.9 |
| Average Annual Low | 40.8 |
| Annual Precipitation Days | 98.6 |
| Average Annual Precipitation | 42.9 |
| Average Annual Snowfall | 71.2 |
Average High
Days of Rain
Source: NOAA climate normals (30-year)
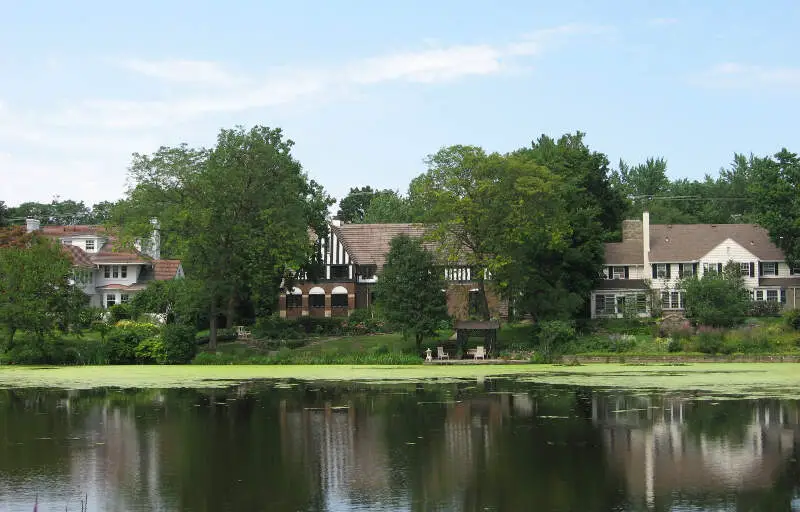
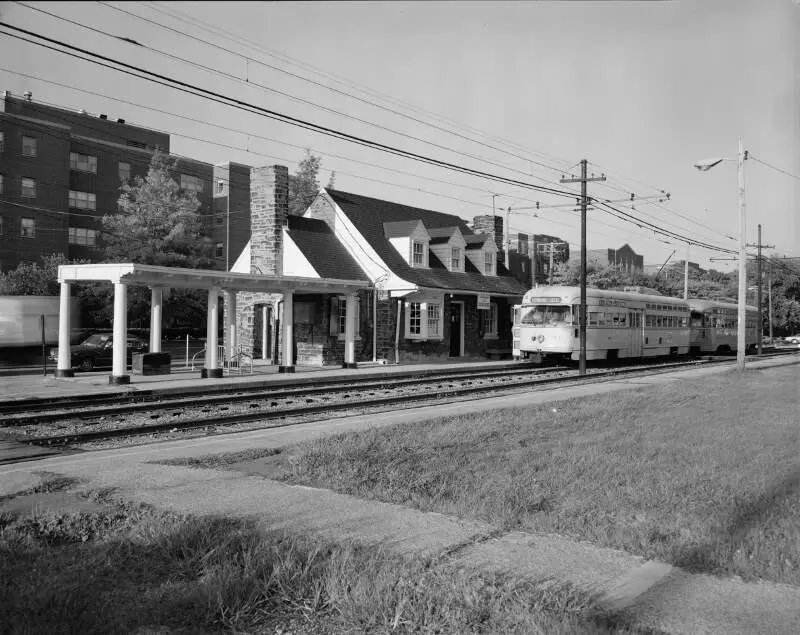
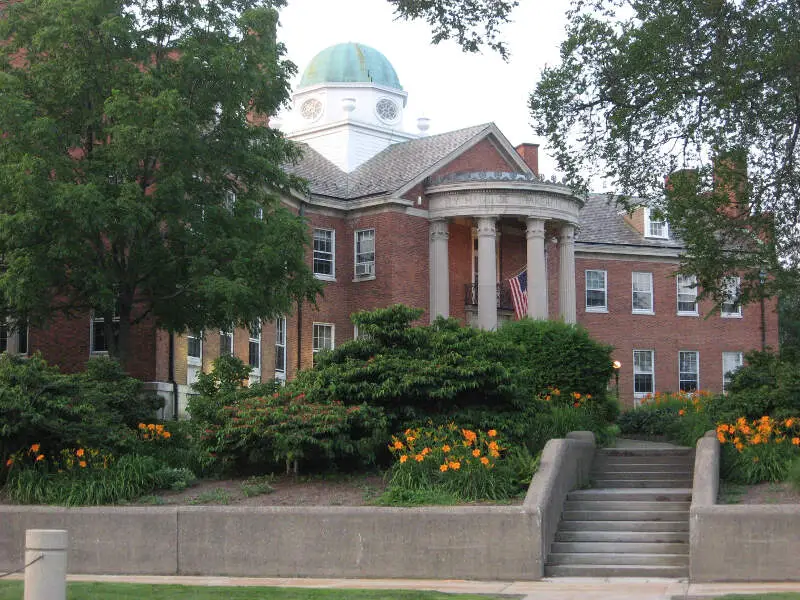
Shaker Heights, OH Photos

Rankings & Articles For Shaker Heights


Locations Around Shaker Heights
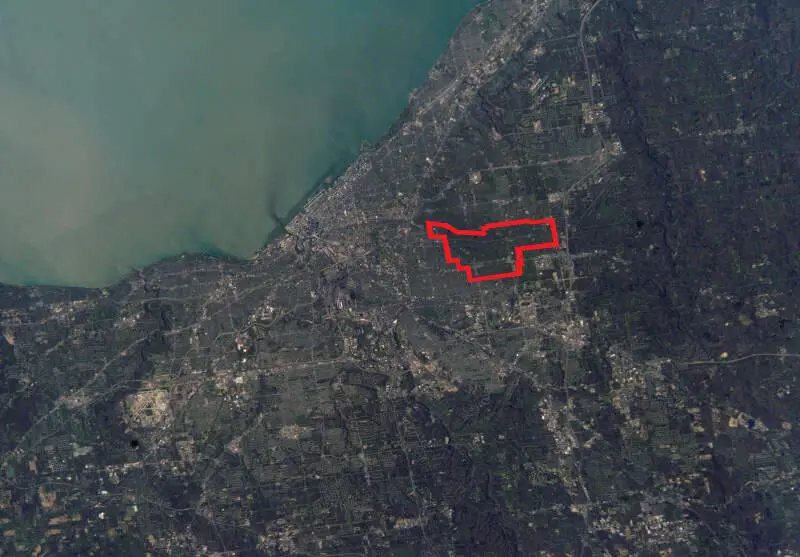
Map Of Shaker Heights, OH
Best Places Around Shaker Heights
Hudson, OH
Population 23,039
Westlake, OH
Population 34,104
Highland Heights, OH
Population 8,623
Macedonia, OH
Population 12,152
Pepper Pike, OH
Population 6,840
Solon, OH
Population 23,943
North Olmsted, OH
Population 31,924
Broadview Heights, OH
Population 19,771
Strongsville, OH
Population 45,983
Rocky River, OH
Population 21,490
Shaker Heights Demographics And Statistics
Population over time in Shaker Heights
The current population in Shaker Heights is 28,922. The population has increased 1.6% from 2010.
| Year | Population | % Change |
|---|---|---|
| 2024 | 28,922 | -0.3% |
| 2023 | 29,004 | -0.5% |
| 2022 | 29,157 | -0.1% |
| 2021 | 29,197 | 7.5% |
| 2020 | 27,148 | -0.9% |
| 2019 | 27,387 | -0.8% |
| 2018 | 27,620 | -0.5% |
| 2017 | 27,749 | -0.1% |
| 2016 | 27,773 | -0.6% |
| 2015 | 27,934 | -0.5% |
| 2014 | 28,071 | -0.5% |
| 2013 | 28,200 | -0.3% |
| 2012 | 28,289 | -0.4% |
| 2011 | 28,396 | -0.2% |
| 2010 | 28,458 | - |
Race / Ethnicity in Shaker Heights
See the full breakdown
Shaker Heights is:
53.4% White with 15,438 White residents.
32.9% African American with 9,529 African American residents.
0.1% American Indian with 16 American Indian residents.
3.8% Asian with 1,090 Asian residents.
0.0% Hawaiian with 0 Hawaiian residents.
0.9% Other with 267 Other residents.
4.6% Two Or More with 1,334 Two Or More residents.
4.3% Hispanic with 1,248 Hispanic residents.
| Race | Shaker Heights | OH | USA |
|---|---|---|---|
| White | 53.4% | 75.8% | 57.4% |
| African American | 32.9% | 12.0% | 11.9% |
| American Indian | 0.1% | 0.1% | 0.5% |
| Asian | 3.8% | 2.5% | 5.9% |
| Hawaiian | 0.0% | 0.0% | 0.2% |
| Other | 0.9% | 0.4% | 0.6% |
| Two Or More | 4.6% | 4.3% | 4.3% |
| Hispanic | 4.3% | 4.8% | 19.3% |
Gender in Shaker Heights
See the full breakdown
Shaker Heights is 53.3% female with 15,426 female residents.
Shaker Heights is 46.7% male with 13,496 male residents.
| Gender | Shaker Heights | OH | USA |
|---|---|---|---|
| Female | 53.3% | 50.7% | 50.5% |
| Male | 46.7% | 49.3% | 49.5% |
Highest level of educational attainment in Shaker Heights for adults over 25
See the full breakdown
-1.0% of adults in Shaker Heights completed < 9th grade.
2.0% of adults in Shaker Heights completed 9-12th grade.
8.0% of adults in Shaker Heights completed high school / ged.
14.0% of adults in Shaker Heights completed some college.
7.0% of adults in Shaker Heights completed associate's degree.
29.0% of adults in Shaker Heights completed bachelor's degree.
23.0% of adults in Shaker Heights completed master's degree.
10.0% of adults in Shaker Heights completed professional degree.
8.0% of adults in Shaker Heights completed doctorate degree.
| Education | Shaker Heights | OH | USA |
|---|---|---|---|
| < 9th Grade | -1.0% | 3.0% | 4.0% |
| 9-12th Grade | 2.0% | 6.0% | 6.0% |
| High School / GED | 8.0% | 32.0% | 26.0% |
| Some College | 14.0% | 19.0% | 19.0% |
| Associate's Degree | 7.0% | 9.0% | 9.0% |
| Bachelor's Degree | 29.0% | 19.0% | 22.0% |
| Master's Degree | 23.0% | 9.0% | 10.0% |
| Professional Degree | 10.0% | 2.0% | 2.0% |
| Doctorate Degree | 8.0% | 1.0% | 2.0% |
Household Income For Shaker Heights, Ohio
See the full breakdown
3.9% of households in Shaker Heights earn Less than $10,000.
1.6% of households in Shaker Heights earn $10,000 to $14,999.
4.8% of households in Shaker Heights earn $15,000 to $24,999.
8.4% of households in Shaker Heights earn $25,000 to $34,999.
8.0% of households in Shaker Heights earn $35,000 to $49,999.
12.8% of households in Shaker Heights earn $50,000 to $74,999.
8.7% of households in Shaker Heights earn $75,000 to $99,999.
14.6% of households in Shaker Heights earn $100,000 to $149,999.
12.8% of households in Shaker Heights earn $150,000 to $199,999.
24.4% of households in Shaker Heights earn $200,000 or more.
| Income | Shaker Heights | OH | USA |
|---|---|---|---|
| Less than $10,000 | 3.9% | 5.2% | 5.0% |
| $10,000 to $14,999 | 1.6% | 4.0% | 3.4% |
| $15,000 to $24,999 | 4.8% | 7.1% | 6.3% |
| $25,000 to $34,999 | 8.4% | 7.5% | 6.6% |
| $35,000 to $49,999 | 8.0% | 11.6% | 10.1% |
| $50,000 to $74,999 | 12.8% | 16.9% | 15.5% |
| $75,000 to $99,999 | 8.7% | 13.1% | 12.6% |
| $100,000 to $149,999 | 14.6% | 17.1% | 17.5% |
| $150,000 to $199,999 | 12.8% | 8.3% | 9.6% |
| $200,000 or more | 24.4% | 9.1% | 13.4% |
Source: U.S. Census ACS 5-year estimates (2024)


